“NO, WE ARE STILL NOT THERE YET”
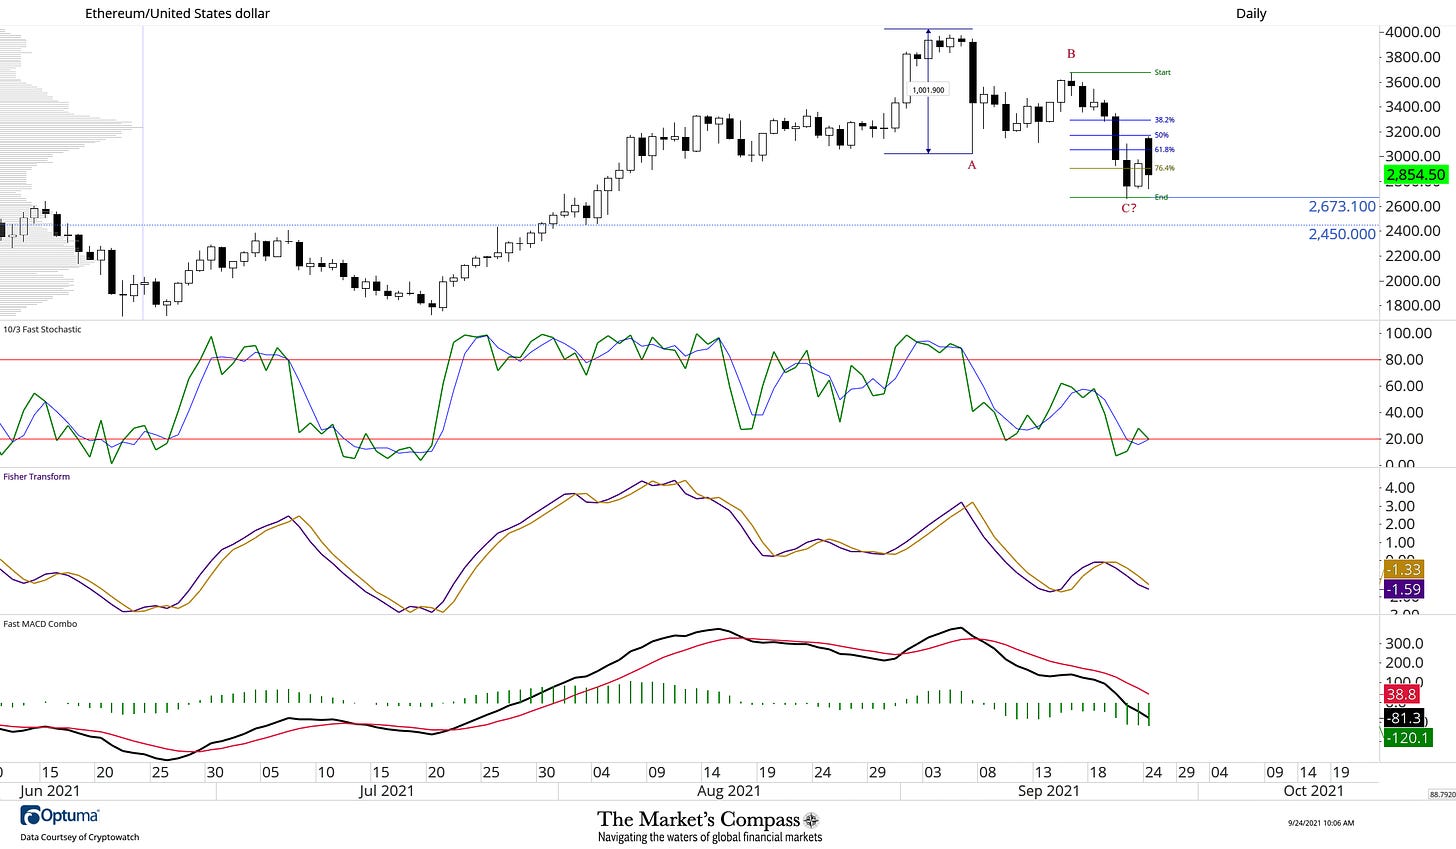
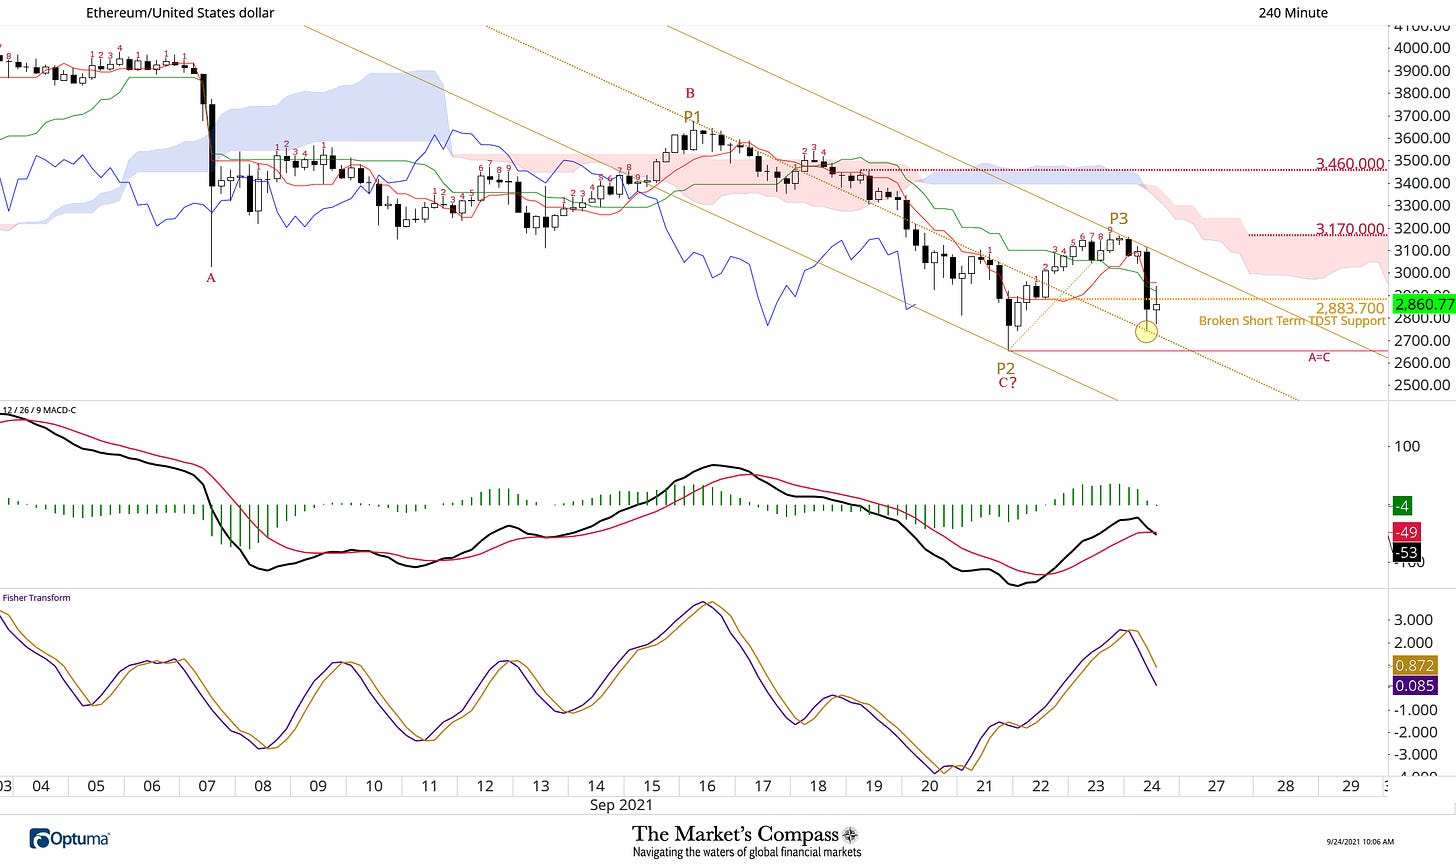
On Monday, the selloff in Ethereum reversed at a level that marked Wave A (in red) equaling Wave C (a common relationship in an ABC correction) suggesting that the corrective phase since the September 3rd high might have run its course (see daily chart above). On Wednesday morning the rally followed through but yesterday the rally began to fizzle out (note the Doji at P3, see 240- min chart below) and early this AM a sharp reversal developed that broke TDST support at 2,883.70. Although the pullback has held median line support of the newly drawn Standard Pitchfork (gold P1 through P3 at yellow circle) there has been a turn in price momentum on the 240-min time frame. Only a rally back above Cloud resistance at 3,170 would change our “wait and see” stance.

