Bitcoin, Ethereum, and XRP Price Prediction For The Coming Week!

The post Bitcoin, Ethereum, and XRP Price Prediction For The Coming Week! appeared first on Coinpedia Fintech News
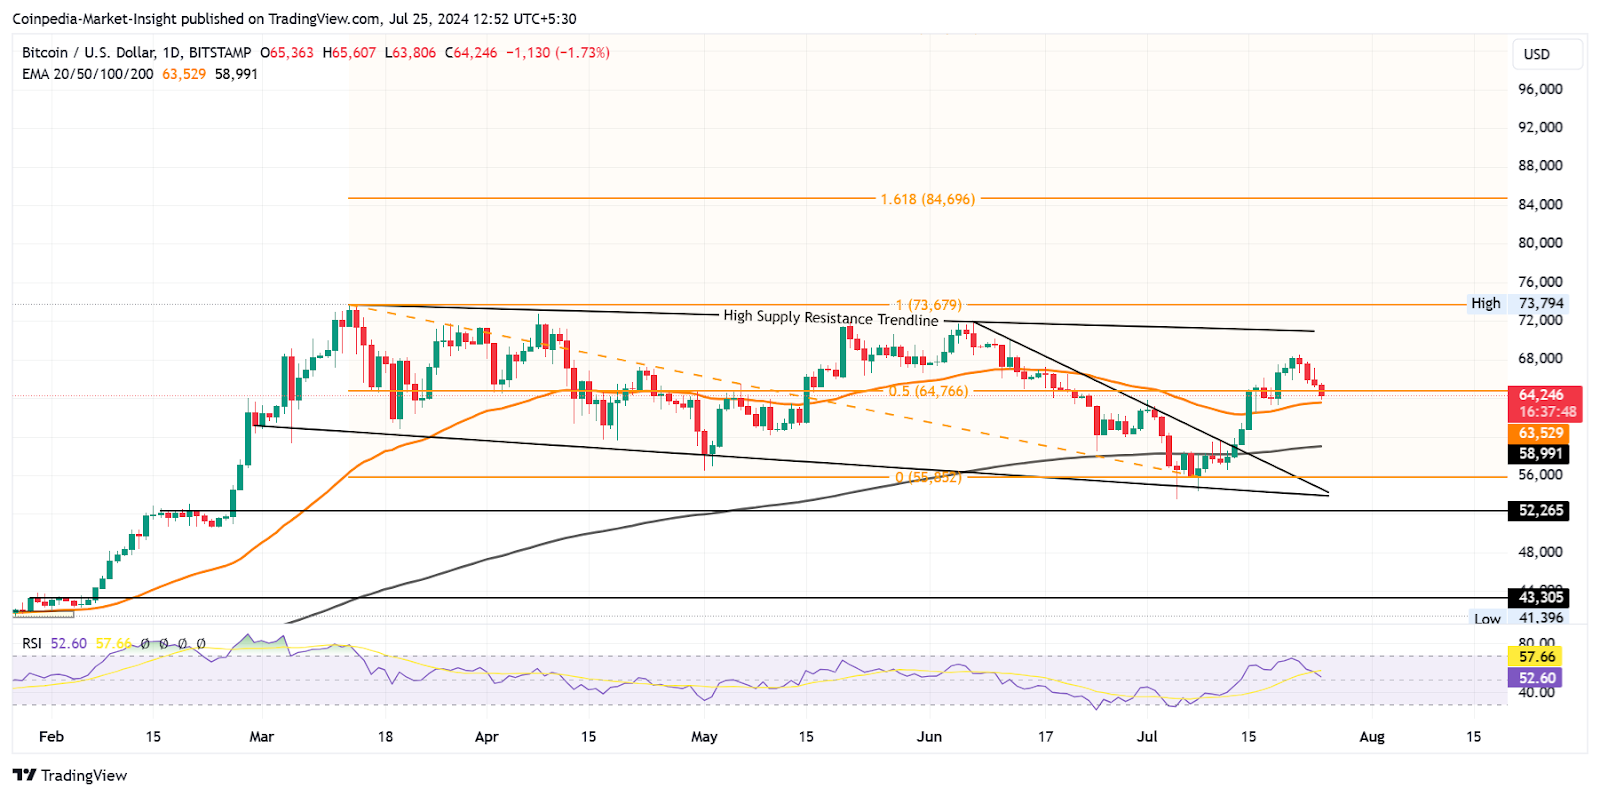
The cryptocurrency industry continues to display a significant fluctuation in the chart, suggesting an increased price action in the market. Further, the market leader, Bitcoin price, has successfully claimed a new all-time high of over $73,000, highlighting a positive outlook for the market in the coming time.
On the other hand, the altcoin leader, the Ethereum token, had successfully crossed the $4,000 market during the previous week, following which it experienced a significant correction in valuation. Further, the XRP token has displayed a similar trend, indicating increased volatility in the crypto space.
Bitcoin (BTC):
The Bitcoin price traded in a closed range between $50,540 and $52,853 for a brief period. As the volatility in the market increased, the bulls jumped 24.53% within three days, following which the price faced rejection at $64,287. After trading sideways for a while, the bulls regained momentum and jumped 11.03% before facing rejection at $68,296.
The bulls then lost momentum and tested their low of $61,025, but the bulls quickly regained momentum and leveled all their losses. Following this, the bulls constantly traded under a bullish influence and recorded a new ATH of above $73,000. Since then, the price has been trading under a bearish influence.
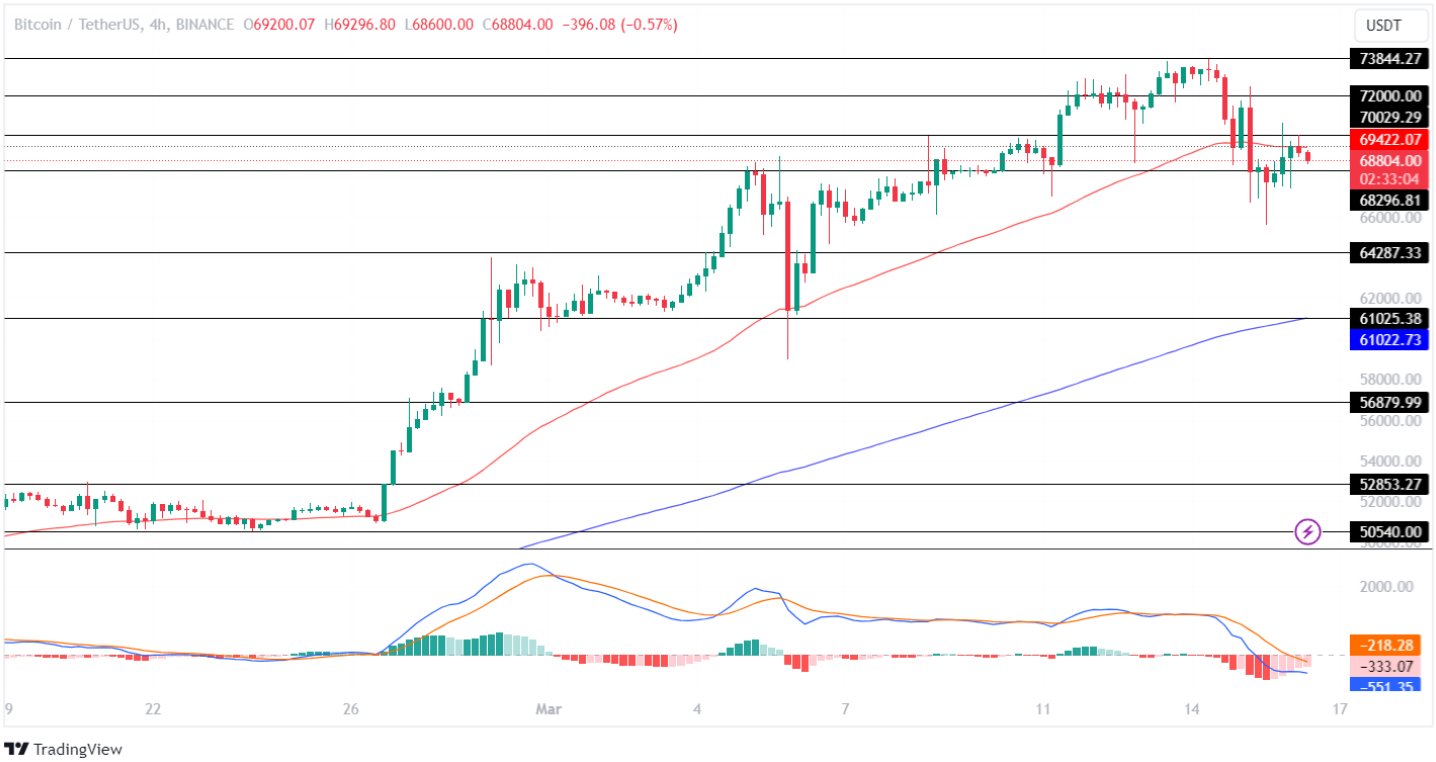
The technical indicator, MACD, displays a decline in the red histogram, indicating a decrease in the bearish influence in the crypto space. Further, the averages show a high possibility of a bullish convergence, suggesting a bullish price action for the BTC price in the coming time.
If the market holds the price above the support level of $68,296, the bulls will regain momentum and prepare to test its upper resistance level of $73,844 during the coming week. Conversely, if the bulls fail to regain momentum, the price will lose momentum and fall to test its lower support level of $64,287.
Ethereum (ETH):
The ETH price traded in a closed range between $2,609 and $2,883 for over a week, after which the bulls gained enough momentum to break out of the resistance level, where the price displayed a neutral trend for the next few days. As the volatility increased, the Ethereum price jumped 16.25% within the next three days, following which the price displayed a neutral trend.
After testing its low of $3,369, the bulls reimagined momentum and recorded a jump of 17.42% before facing rejection at $3,956. Recently, the bulls recorded another jump and successfully reclaimed the $4,000 mark, where the price traded sideways for a while. Since then, the price has been trading under a bearish influence.
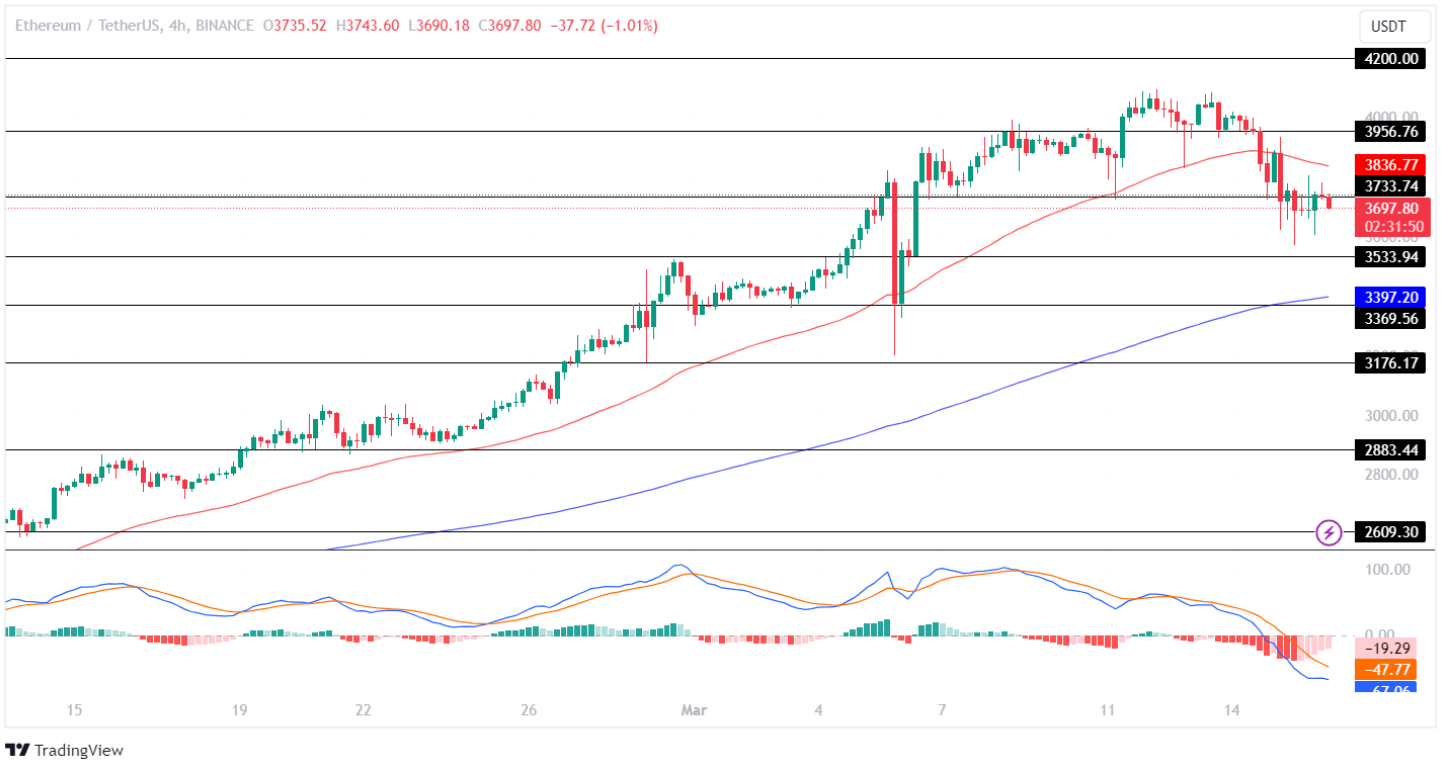
The Moving Average Convergence Divergence (MACD) displays a constant red histogram, indicating an increased bearish influence in the crypto space. Moreover, the averages show a flatline, suggesting uncertainty in the future price action of the coin in the market.
If the market pushes the price above the resistance level of $3,733, the bulls will regain momentum and prepare to test its upper resistance level of $4,200. Negatively, a trend reversal may pull the price toward its lower support level of $3,369 in the coming time.
Ripple (XRP):
The Ripple (XRP) token traded in a consolidated range between $0.530 and $0.578 for about two weeks, following which the bulls gained momentum, and the XRP price jumped 13.5% before facing rejection at $0.6015. After this, the price displayed a neutral trend by trading between $0.578 and $0.601 for a while.
As the market volatility grew, the bulls successfully broke out of the resistance level, where they traded between $0.6015 and $0.6625 for a brief period. Recently, the bulls jumped 21.52%, after which it faced rejection at $0.7310. Since then, the price has been displaying a negative trend in the chart.

The MACD displays a constant decline in the red histogram, highlighting a decrease in the selling pressure within the crypto industry. Further, the averages show a potential bullish curve, suggesting the price may undergo a bullish price action during the coming week.
If the market holds the price above the support level of $0.6290, the bulls will regain momentum and prepare to test its upper resistance level of $0.6930. Conversely, if the bears overpowered the bulls, the price would lose momentum and fall to test its lower support level of $0.5780 in the upcoming week.
Related Posts