Bitcoin has been put through the Meat Grinder
Summary
I stopped by my local meat market yesterday. I greeted the butcher, “Afternoon Amelio, may please have a pound of ground sirloin”. “Ground sirloin! I feel like my Bitcoin is being put through my meat grinder… How about some ground Bitcoin?! What should I do now”? Needless to say my butcher knows my professional background as technical analyst following financial markets.
My response to him was that corrections can be painful, l but they can also present opportunity. I mollified him somewhat with one of my favorite responses from the famous Walter Deemer “When it comes time to buy (or add to positions), you won’t want to”. His response, “I should have expected that kind of answer from you, here’s your chopped meat!” I added that I continued to believe that what we have been witnessing in the price action of Bitcoin has been a correction of the December / Early January rally, but he was already helping the next customer.
In the final days of that leg higher it had become almost parabolic and was inviting a period of “back and filling”. Admittedly, we were surprised by the velocity of the initial drop and equally surprised by yesterday’s sharp break below support at the Kijun Span (green dotted line) at 33,895. This has cradled prices since October (now marking first resistance). Needless to say this has developed into more than just “backing and filling”.
After reaching an intra-day high of 41,969 on January 8th, Bitcoin dropped sharply during the three day sell off that knocked off more $11,000 its value. Before the intra-day reversal developed on the third day Bitcoin was down +27%. The grinding volatile price action that followed led many to suggest that prices were coiling in a triangulating price pattern that would eventually terminate with a continuation of the rally to the upside. It is obvious with today’s break of the rising trend of that triangle, and with an extension of the selloff (down 31% from the January highs to yesterday’s lows), that any technical thesis as to how the correction would finally unfold was premature. In the two time frame analysis that follows we will identify the levels that need to be monitored.
Only a break of key support at 28,510.00 would suggest that the corrective phase is possibly more than a 4th wave correction of a larger degree.
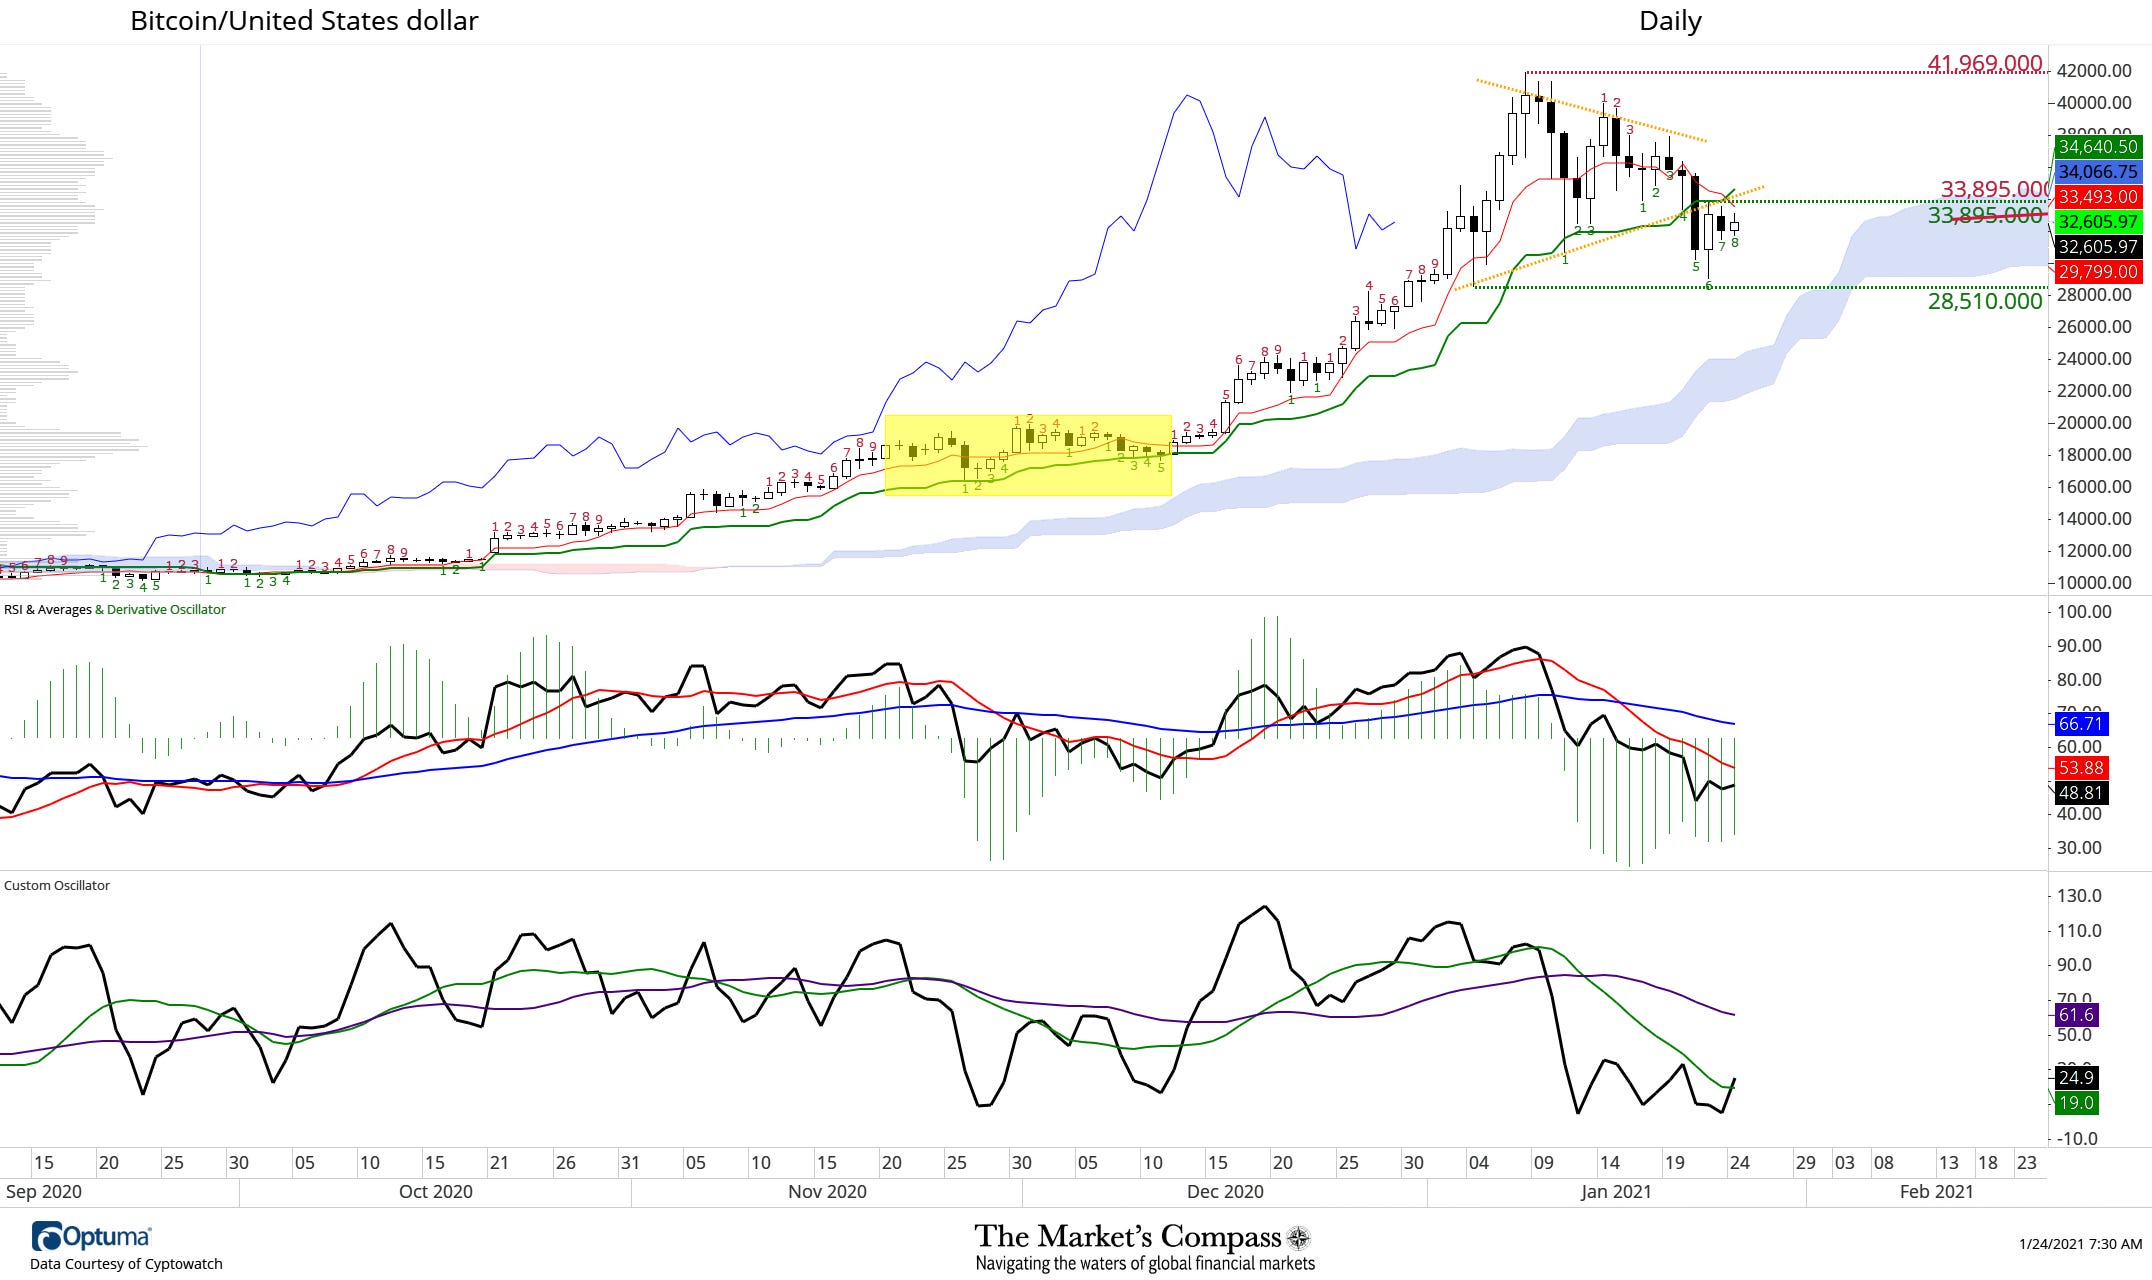
Daily Time Frame
The Daily time frame chart of Bitcoin reveals that during the final days of the December / early January rally, the price action became parabolic and was inviting a period of corrective price action. After reaching an intra-day high of 41,969 on January 8th Bitcoin dropped sharply. On the third day of the selloff more $11,000 had been knocked off its value. Before intra-day reversal developed Bitcoin was down +27%. The grinding volatile price action that followed led many to suggest that prices were coiling in a triangulating price pattern that would eventually terminate with a continuation of the rally to the upside. It is obvious that with today’s violation of the rising trend of the triangle, along with an extension of the selloff (down 31% from the January highs to yesterday’s intra-day lows), that any technical thesis as to how the correction would finally unfold was premature.
For those familiar with Demark Buy and Sell Setups (small red and green numbers on chart), there is a technical feature that confirmed price action was not a sideways triangulating chop. During sideways corrections, the Setup numbers do not normally exceed “5” (please note the late November / early December consolidation in the yellow box). With yesterday’s print of a TD Buy Setup “7”, and break of lower trend support and today’s “8”, it is suggested that the correction that is unfolding is far more complex. More technical evidence is required to determine just what we “have on our hands”. The 240-time minute frame analysis with Andrews Pitchfork analysis that follows will give readers a few “road signs” to watch for.
We now mark first resistance at previous support at 33,895.
At the end of our analysis there is a link to my “Tools of Technical Analysis” that is available on my website. The aim is that it will help readers to understand Demark Buy and Sell Setups and Andrews Pitchfork.
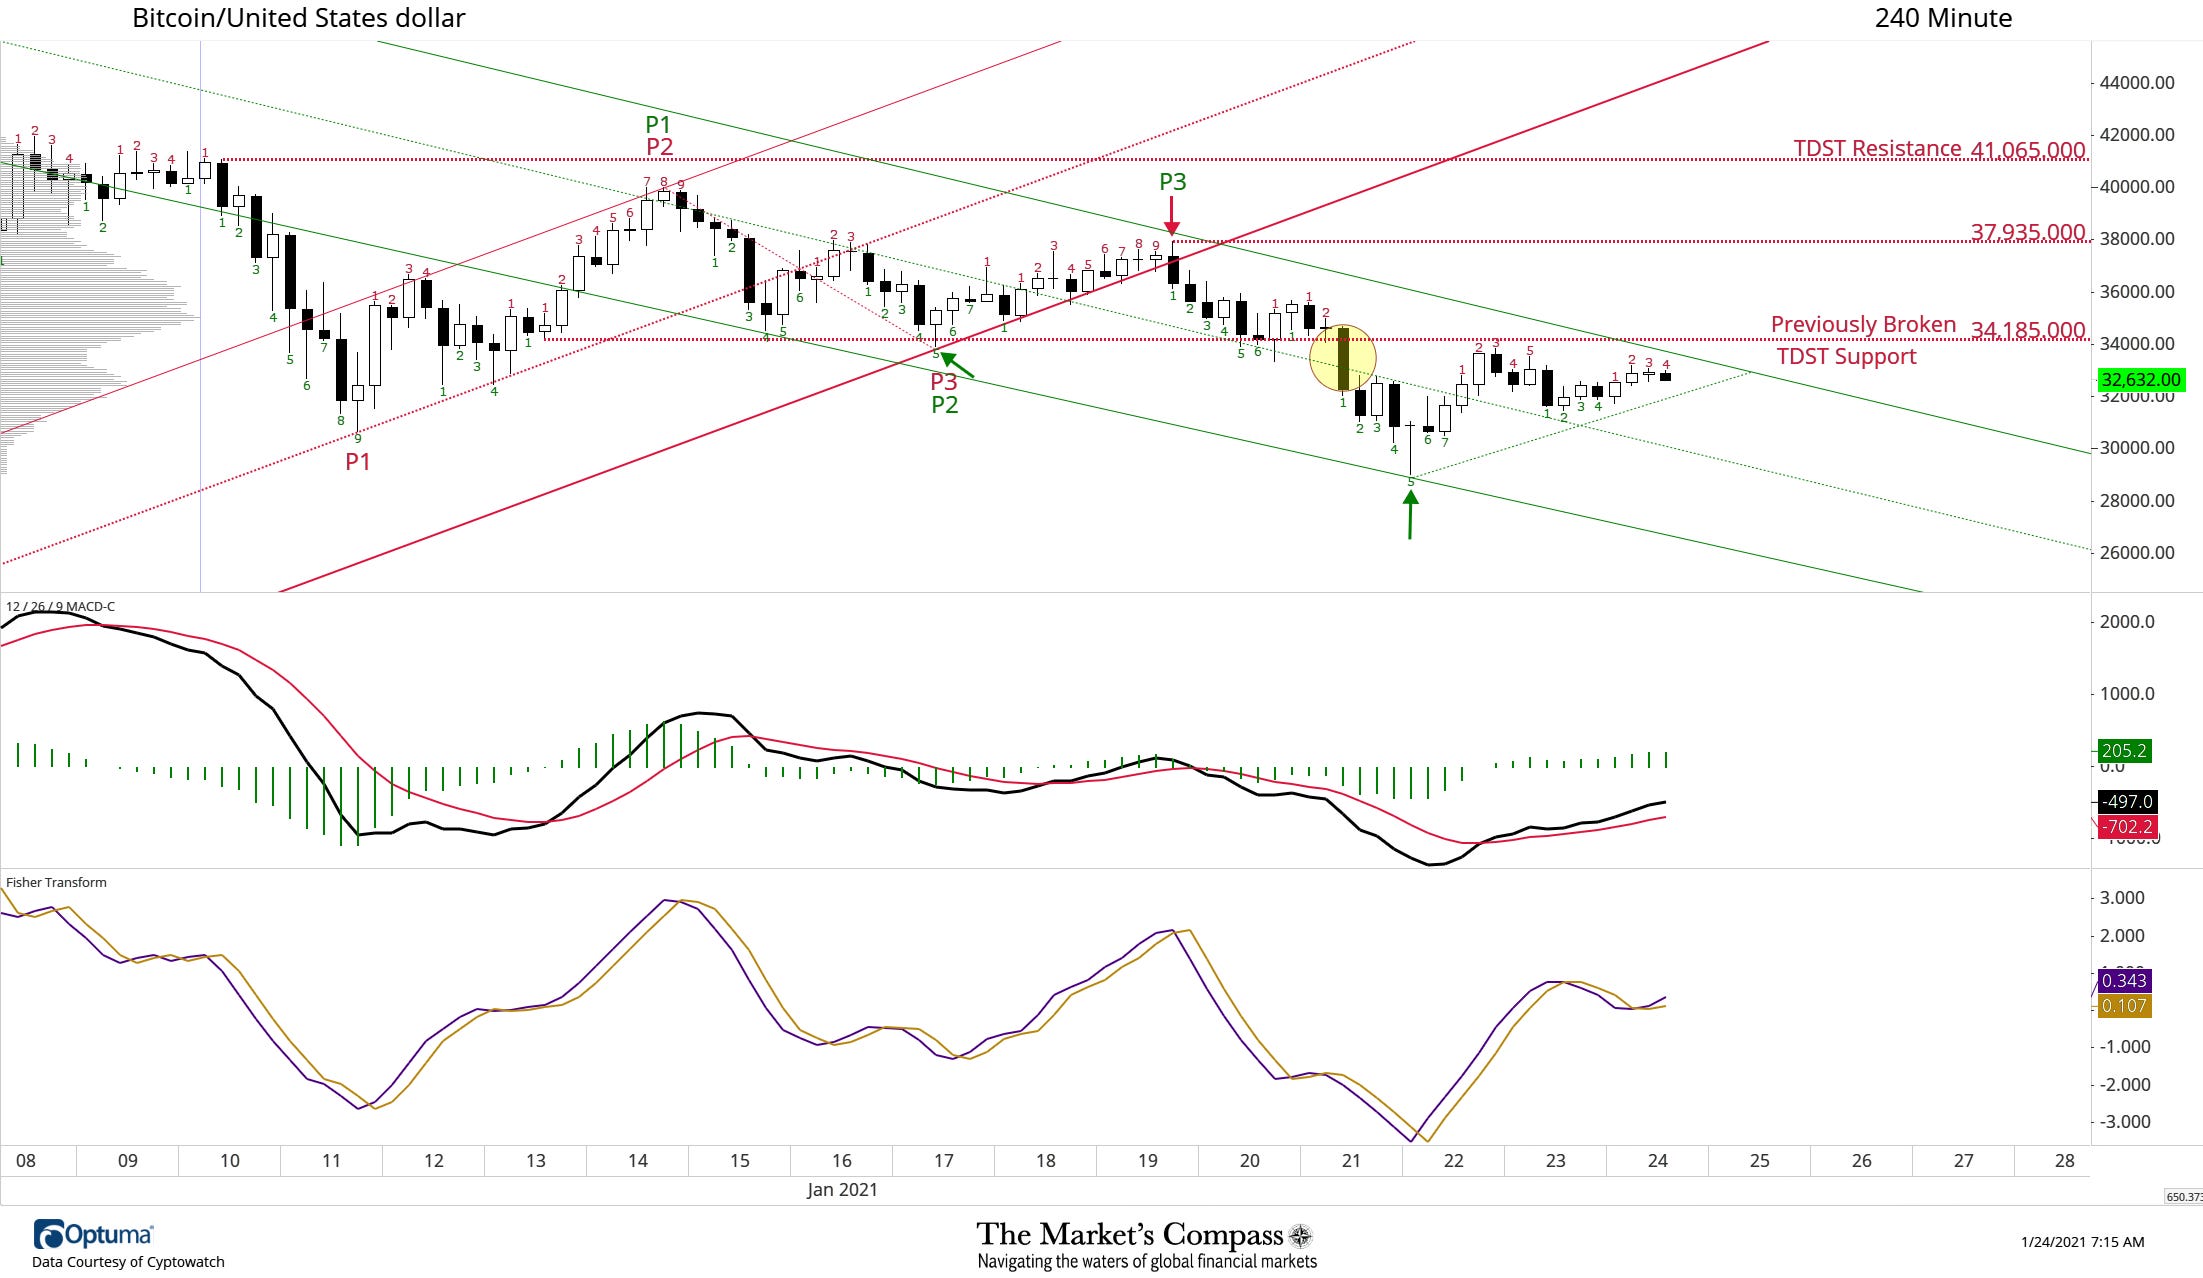
240-Minute Time Frame
All Forked Up. When prices pivoted for the second time at TDST Support at 31,185, a slightly lower intra-day low on Sunday, we drew the new Standard Pitchfork (red P1 through P3). It walked the tightrope of the Lower Parallel of that Pitchfork for more than two days, until late Tuesday night when prices fell through that support (red arrow). This gave birth to the new inverted Standard Pitchfork (green P1 through P3). The Median Line of the shorter term inverted Standard Pitchfork (green dotted line), and previous TDST Support at 34,185.00 held as support until Thursday morning (yellow circle). Bitcoin bottomed at the Lower Parallel of the shorter term Pitchfork Friday Morning (green arrow) validating the vector of the falling trend (green arrow). Although price rose above the Median Line (green dotted line), Friday’s previously broken TDST support at 34,185 now resistance has capped any further advance.
The technical purpose of this long winded description of the 240-min price action is to bring the reader’s attention to the fact that there is little technical evidence on the 240-min chart that corrective price action that has developed since the parabolic price high has run its course.
Only a rally that breaks free of the short term down trend, marking a higher short term high above 37,935, would suggest Bitcoin may be out of the woods.
Resources and Learning
To learn more about the tools I use to develop my technical theses in crypto currencies and other financial markets, follow the link below for a brief tutorial. The tutorial is titled “Tools of Technical Analysis”.
There is also a three part Andrews Pitchfork series co-authored with Kyle Crystal of Lakeshore Technical Analysis. Both are available on my website.
https://www.themarketscompass.com
Follow the link below for an exclusive 30-day free trial of Optuma’s Charting Sortware: