Crypto Strategist Who Predicted Bitcoin Rejection At $70,000 Reveals Where Price Is Headed Next
A crypto strategist who accurately predicted the current Bitcoin downtrend has shown where the price is headed from here. If the analyst’s prediction is anything to go by, then the decline in the crypto market may only just be in its beginning stages.
Bearish Indicators Pile Up For A Bitcoin Crash
Earlier this week, when the crypto market was still euphoric with the Bitcoin climb above $70,000, crypto analyst Xanrox was one of the few who called a possible decline in price. The analyst took to the TradingView website to share this analysis, where he showed that indicators point to a Bitcoin price retrace.
According to the analyst’s initial post, Bitcoin is going to crash in June and the reason lie in the price action that was seen in May. One of the indicators that Xanrox points to is the “FVGAP” that was created at $62,000, and as the analyst explains, this can signal a bullish trend for the digital asset. This is mainly because this gap that was created at $62,000 are filled out “sooner rather than later,” suggesting that the retrace could be happening soon.
Another indicator that the analyst points to is the Elliott Wave perspective, pointing out that the Bitcoin price has finished the first impulsive Wave 1. Naturally, as the market moves in waves, the next wave, Wave 2, is expected to be bullish. But that is not all, as Xanrox points out the creation of a corrective ABC pattern from here.
Last but not least, the analyst points out a small red trend line that has formed in the chart and is already breaking down. Such breakdowns in the trend line are bearish; add in the rising wedge pattern that the analyst sees in the chart, and it seems to be a perfect recipe for a decline.
Xanrox initially posted his analysis on Wednesday, May 29, and since then, the Bitcoin price has broken down below $68,000, suggesting this prediction could come to pass. As a result, the analyst has now updated the post, showing where the price could be headed next.
Next Steps For BTC
In the follow-up posts, Xanrox points out that another red trend line is now breaking down after the first. With two in a row, it paints a very negative picture from the Bitcoin price from here. Additionally, the crypto analyst revealed that the BTC price has formed a symmetrical triangle, which he expected to break down. When this happens, the price is expected to fall.
As for how far Bitcoin can fall from here, the analyst’s original chart shows a breakdown toward the $62,000 level. This would mean an over 10% decline in the price, something that could shake prices all across the market. “Currently, I am bearish, so be careful during the summer as the price action is not the most volatile for Bitcoin during this season,” the analyst warned.
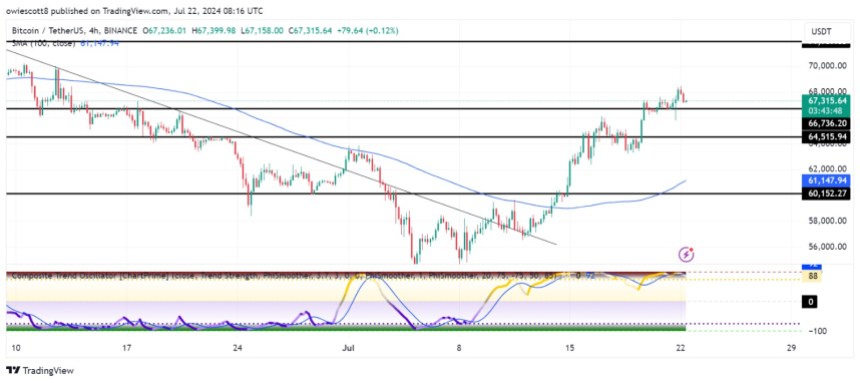
As for Bitcoin, it is currently sitting just below $68,000, at the time of writing, with 2.7% losses in the last week. However, the monthly remains green for the pioneer cryptocurrency as it’s seeing 10.28% gains.


