Fantom Price Analysis: Bulls Attempt to Push FTM Price Higher Towards $0.5 Level

The post Fantom Price Analysis: Bulls Attempt to Push FTM Price Higher Towards $0.5 Level appeared first on Coinpedia - Fintech & Cryptocurreny News Media| Crypto Guide
Looking at the price increase of FTM in recent days, the token looks like a good investment. FTM price was bearish during the initial phase but is currently bullish and still increasing its price. However, the recovery is slow, but at least the price movement is positive as the price has reached the $0.338 level.
Fantom Price Analysis for Long Term
Bulls have taken control of the price action for today’s session, as seen in the 1-day Fantom price chart. The FTM/USD pair has been rising steadily since then, closing at $0.338. In the last 24 hours, the crypto pair has appreciated by 21.72%, trading positively.
From the Fantom price analysis, it is evident that the overall market trend is positive and FTM is currently in an uptrend. The support level has been created at $0.33 and the resistance level at $0.35. The MACD indicator is also showing a bullish crossover, which indicates that the price might go up in the near future.
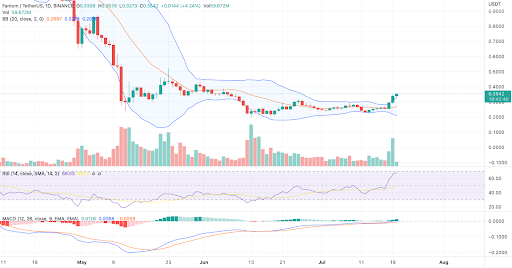
The RSI indicator is currently at the 66 level, which indicates that the price is overbought or oversold; this indicates that many investors are confident in FTM. The current market sentiment is positive and the investors are bullish about the future price movement of Fantom.
The price has jumped above the moving average (MA) indicator and it is currently trading at the $0.338 level. The price action is likely to continue its bullish trend in the near future as the market sentiment is positive.
Investors should keep an eye on the $0.35 resistance level as a breakout above this level could see the price move higher towards the $0.40 level. On the downside, the $0.33 level is expected to provide support in case of a correction.
Fantom price analysis for Short Term
The volatility is high on the 4-hour chart as the Bollinger Bands average is forming at $1.184 above the price level, while the upper band is at $0.3420, and the lower band is at the $0.2289 mark. The RSI has also been increasing extremely over the last few hours as it is trading at index 78 overpassing the overbought level.

The price is trading above the moving averages which are acting as a support for the FTM/USD pair. The 50-day SMA is at $0.30, and the 200-day SMA is located at $0.26. These averages will continue to provide support in case of a correction.
The Fantom price is currently in an uptrend as the market sentiment is positive. The price action is likely to continue its bullish trend in the next hours. However, investors should keep an eye on the $0.35 resistance level as a breakout above this level could see the price move higher towards the $0.40 level. On the downside, the $0.33 level.
Related Posts