Has The Bitcoin Correction Run Its Course?
Summary
Bitcoin has overtaken resistance at the Median Line of the Schiff Pitchfork (purple Dashed line) on the Daily Chart, but we will need to see a close above the 19,100 level to confirm that this level of resistance has truly been overcome, and that it will change polarity to support.
If the correction has further to run there is strong support on the Daily chart at 16,100. On the 240-minute time frame chart a number of shorter term resistance levels have been overtaken, but overhead supply has stymied an immediate follow through. Those levels must hold back any bear challenge.
In the very short term, there is a well-defined price channel from Friday on the hourly chart. If a correction of that advance were to develop, there should be a good measure of support at 18,900 level and 18,736 below there. In depth Multi Time Frame analysis is articulated below….
Daily Time Frame
Regular readers of both our Twitter posts and this newsletter know that we have considered the correction since the end of November as a running Elliott 4th Wave decline.
Running corrections by Elliott’s description are corrections that exhibit powerful underlying demand in that the second leg or “B wave” (circled above) marks a new high above the previous swing high, and the terminus of the C wave marks a higher low than wave A and thus far this has been the case.
Another positive technical feature that has lead us to consider that the corrective phase be over is that the Custom Oscillator which is not confined between 0 and 100 did not confirm the new low in RSI (purple dashed line).
If the running correction count is wrong, and more time and price “backing and filling” is needed to correct the rise from the September lows, prices may very well trade below the previous higher low. That said the 16,100 level offers firm support in the Daily time frame.
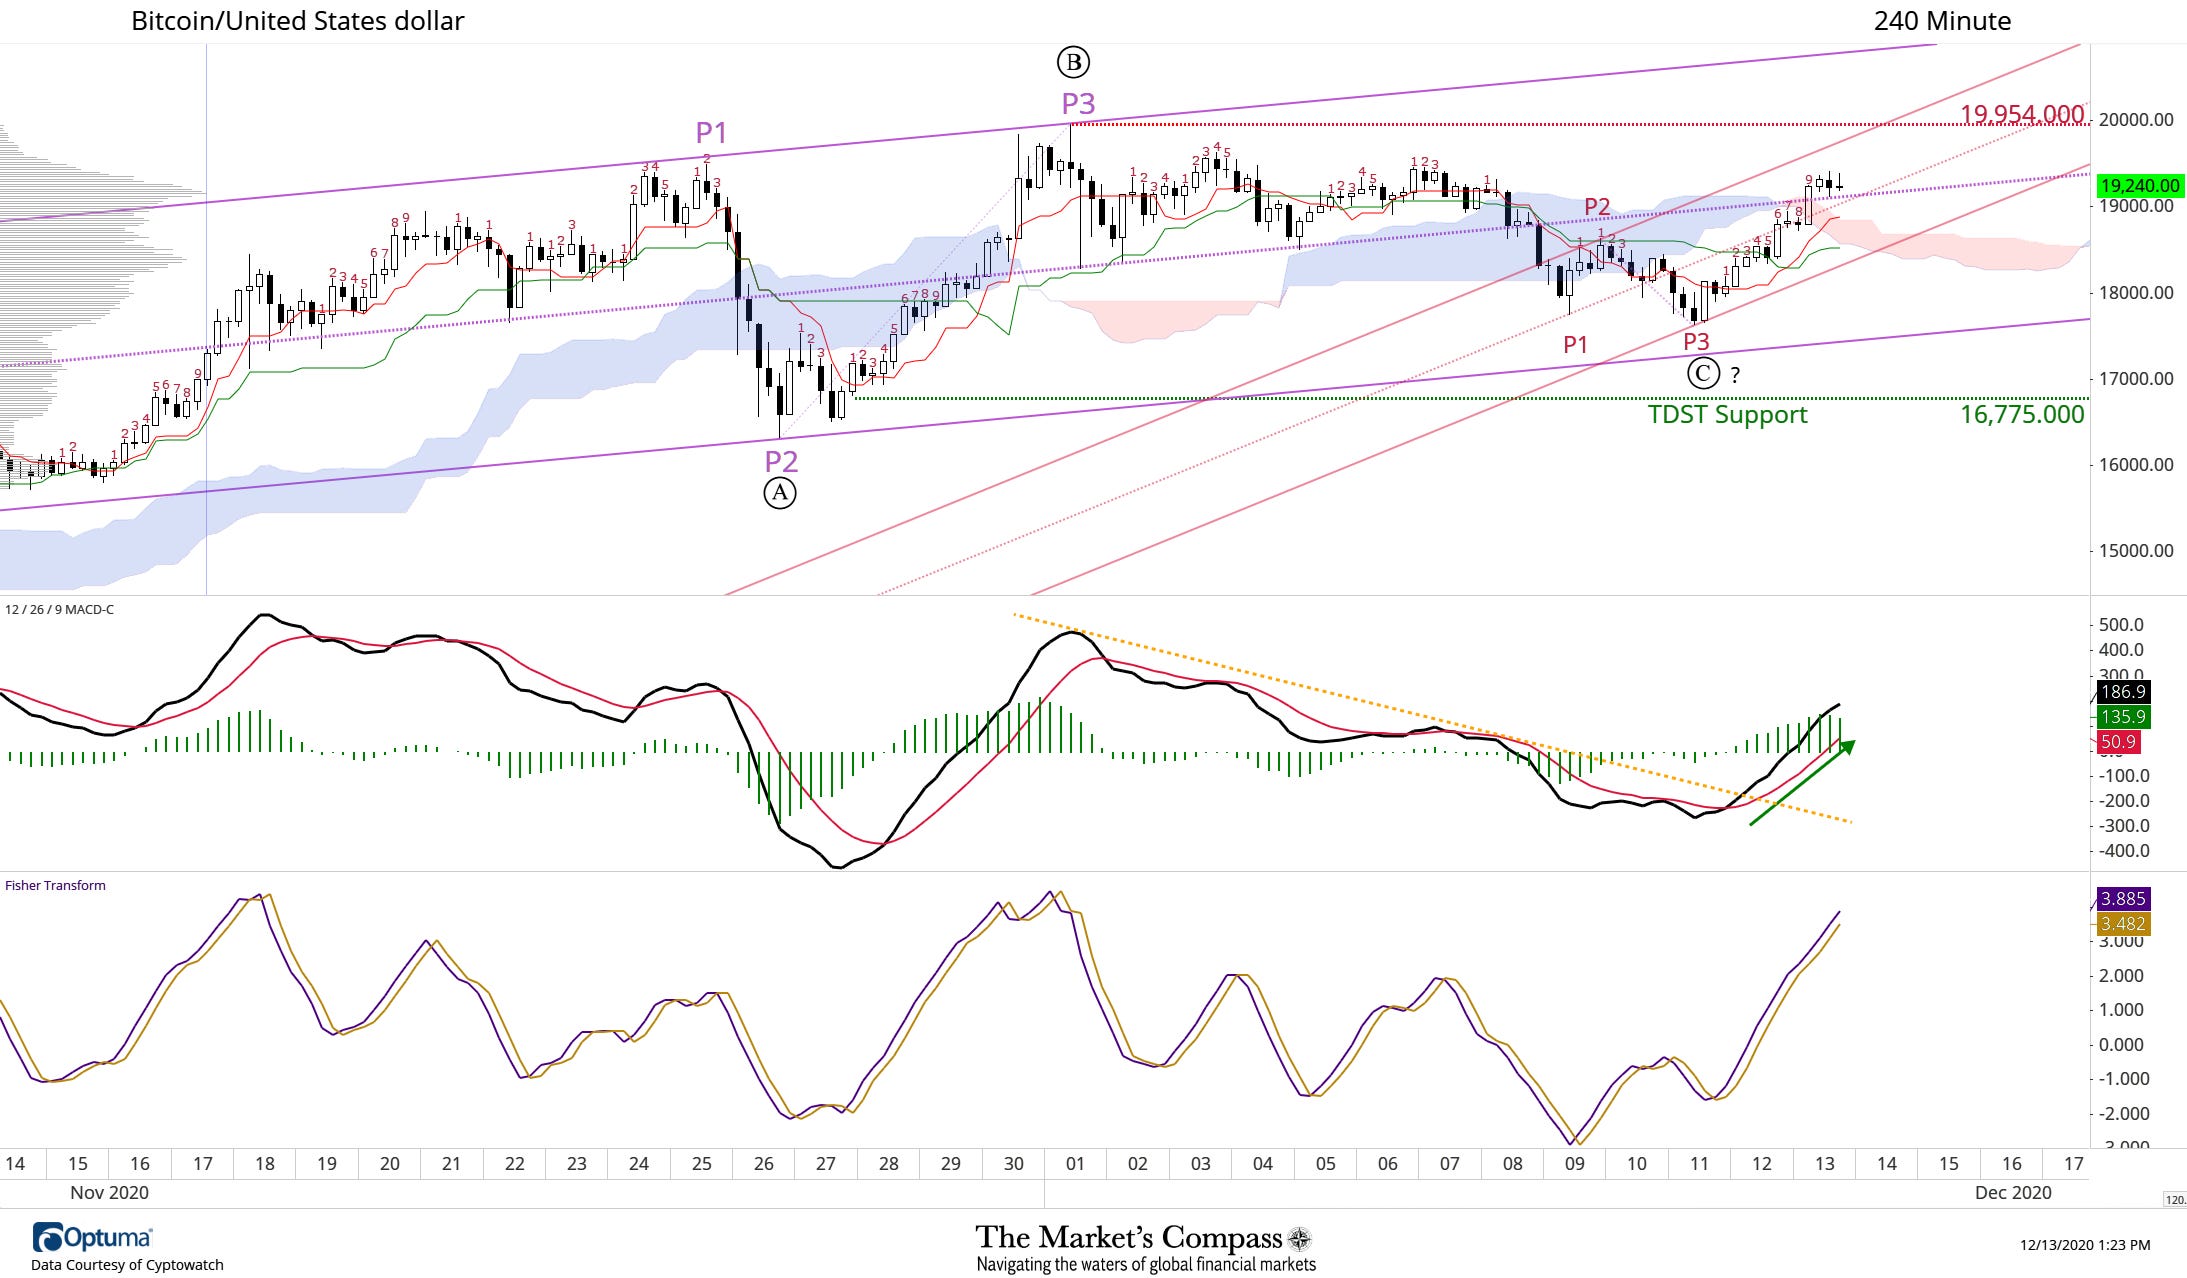
240-Minute Time Frame
The 240-minute time frame chart reflects what we wrote in the summary. A number of shorter term resistance levels have been overtaken.
These include the Median Line of the newly drawn short term Standard Pitchfork (red P1 thrugh P3), Cloud resistance, and the Median line of the longer term Schiff Pitchfork Median Line (purple dashed line).
MACD reflects the regained upside price momentum (green line) after it broke out of the C wave decline. But overhead supply at previous price activity (grey horizontal bars on the left side of the chart) has stymied an immediate follow through. Should the Bears awaken from early hibernation and pressure prices back through Cloud support, C wave is likely incomplete and further corrective price action is on the cards.
To us, the worst case is that TDST support at 16,775.00 will be tested.
60-Minute Time Frame
Bitcoin has risen in a well-defined price channel since Friday’s lows. At that time, MACD crossed its signal line and has tracked higher since, only violating its signal line in the past few hours.
We can’t rule out the potential for a price retracement but expect that the 33-hour moving average (green line) and the first Fibonacci Confluence Support Level at 18,900 will offer a good measure of support. Below that level further support at 18,735.
To learn more about how I use Technical Analysis to navigate crypto markets, follow the link below to get a free trial of Optuma’s Charting Software: www.optuma.com/TMC