Hedgeye: This Model Predicts Bitcoin at $1,000,000

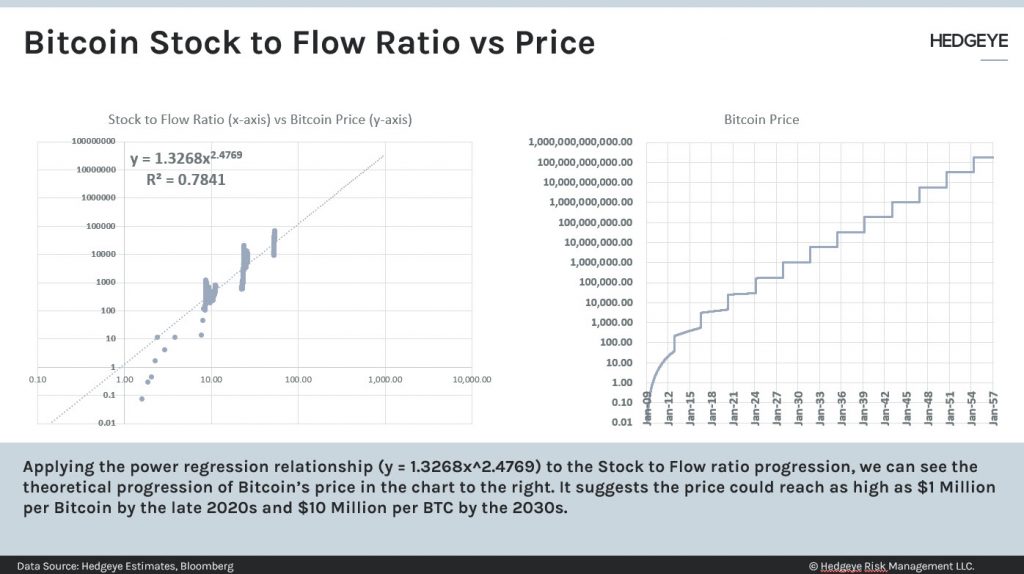
Analysts at Hedgeye Risk Management, an investment research and financial media company based in Stamford, Connecticut, have analyzed the Bitcoin stock-to-flow argument. This framework suggests Bitcoin’s price potentially reaching $1 million by the latter half of 2020s, and as much as $10 million per BTC by the 2030s.
“First they ignore you, Then they laugh at you, Then they fight you, Then you win” -Mahatma Gandhi
At its recent peak, Bitcoin’s market cap hit $1.2 trillion. To give you some perspective, that’s bigger than the four largest banks in the United States combined (JP Morgan, Bank of America, Citi, Wells Fargo), as well as the four largest payments platforms combined (Visa, Mastercard, PayPal, Square).
As most long-term holders understand, a confluence of critical factors will continue to aid in the proliferation of crypto adoption across the world.
Among them:
- Corporations accepting payments via cryptocurrencies
- Institutions holding crypto on their balance sheets
- Asset managers creating new investment vehicles (at the time this was written, there are eight money managers with pending Bitcoin ETF applications)
- The debasement of the U.S. Dollar
- Increasing distrust in centralized political and monetary institutions
The list goes on and on.
Analysts at Hedgeye Risk Management, an investment research and financial media company based in Stamford, Connecticut, have analyzed the Bitcoin stock-to-flow argument – in line with their approach of observing financial markets through a quantitative lens (which is noticeably devoid of qualitative, narrative-based “calls”).
This framework suggests Bitcoin’s price potentially reaching $1 million by the latter half of 2020s, and as much as $10 million per BTC by the 2030s.
Hedgeye was founded in 2008 by former buy-side analysts to democratize access to hedge-fund quality investment research for everyday investors. In an effort to expand the scope of its research process, Hedgeye’s Macro team created an exhaustive, daily quantitative dashboard on a range of cryptocurrencies and ETFs, aptly named the “Bitcoin Trend Tracker”.
This “Crypto Quant” dashboard breaks down the 1) Price 2) Volume, and 3) Volatility among several other metrics of each asset it tracks. (You can watch Hedgeye Macro analyst Christian Drake’s 30-minute explainer video on how to use the Tracker here).
The goal is simple: Give investors the same high-quality quantitative data for cryptocurrencies available for other asset classes, reflective of the reality that crypto is here to stay. The “Bitcoin Trend Tracker” is no different from Hedgeye’s other proprietary tools which utilize market-based signaling to stay ahead of large movements in any asset.
In addition, one of Hedgeye’s analysts, Josh Steiner, has also performed a fundamental analysis by comparing the Stock-to-Flow model of Bitcoin to that of other hard assets and comparing the evolution of Bitcoin’s price to that Stock-to-Flow framework. Below is a summary of that analysis.
To be clear, it should go without saying that numerous, legitimate risks exist to being long Bitcoin. Smart investors need to be mindful of these risks. They run the gamut and include potential regulatory risk, as well as competitive and technological risk. Anyone who owns Bitcoin (or any cryptocurrency for that matter) needs to be mindful of these potential land mines and risk manage them accordingly.
 (You can access the slides featured in this article here)
“The idea here is a simple one,” Steiner explains.
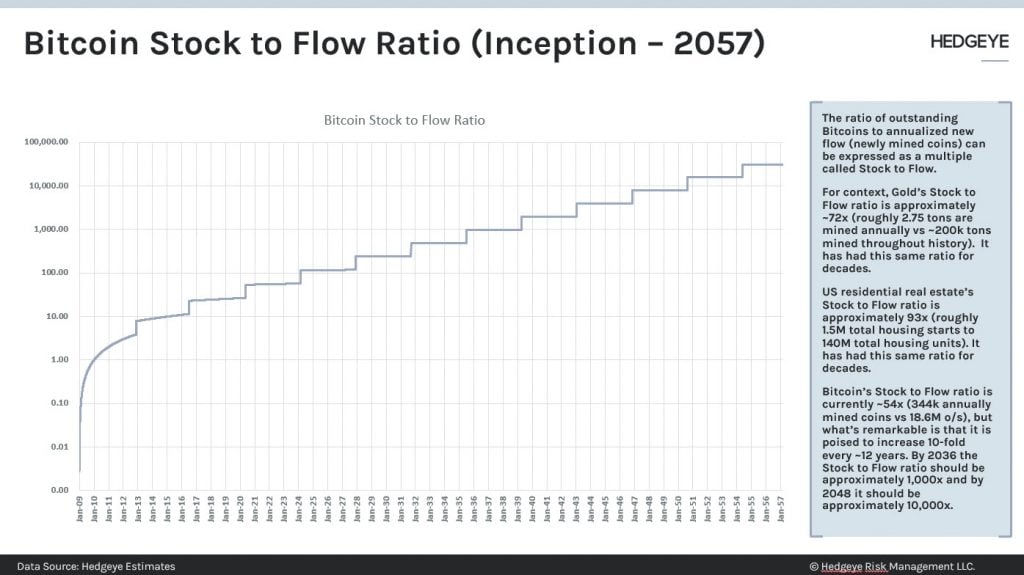
“If you look at the ratio of outstanding supply relative to the flow rate of that supply, you can get the stock-to-flow ratio. Bitcoin’s Stock-to-Flow ratio is currently 54x; roughly 344,000 BTC are being mined annually on an outstanding base of about 18.6 million BTC.
But what’s remarkable about Bitcoin is that it possesses a pre-programmed creation-decline roughly every ~4 years; during each of these events, the reward for mining Bitcoin is cut in half.
That means the Stock-to-Flow ratio is poised to increase logarithmically, roughly 10-fold, every 12 years.
To put that in perspective, by 2036 we should be at a Stock-to-Flow ratio of approximately 1000x – or more than 10x the stock-to-flow of Housing (93x) or Gold (72x). By 2048, there will be another 10-fold increase, which would take the Stock-to-Flow up to 10,000x.”

In plain English, Bitcoin is mathematically designed to exponentially increase its Stock-to-Flow ratio until it ultimately mathematically converges toward infinity. This is both relative to its current state, and relative to other hard-money assets like Housing and Gold. A higher Stock-to-Flow ratio indicates that less new supply is entering the market relative to an asset’s existing, outstanding supply.
In other words, an asset with a higher Stock to Flow ratio should, relative to other assets, retain its value better over the long-term. In a world of easy money and U.S. Dollar debasement, it’s easy to understand Bitcoin’s appeal as not just a hard-money asset, but as an ultra-hard-money asset. Unlike real estate and gold, which have high, but relatively static, Stock-to-Flow multiples, Bitcoin’s Stock-to-Flow ratio will keep increasing exponentially for the next 100+ years.
Steiner circles back to the abiding issue mentioned earlier, the impact on price.
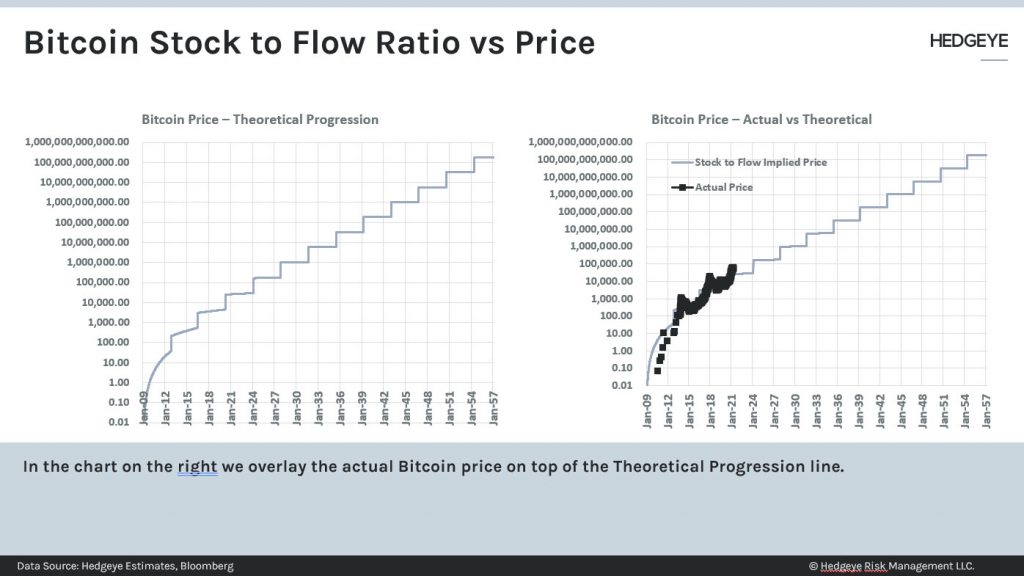
In the chart below, Steiner plots a time-series of Bitcoin’s price (y-axis) versus the Stock-to-Flow ratio as it changes over time (x-axis) out through 2057. Perhaps most importantly, the black dots in the right-hand chart reflect Bitcoin’s historical price versus the theoretical progression implied by the Stock-to-Flow ratio… and it has followed the model very closely thus far.

With over two decades of investing analysis under his belt, Steiner used every regression analysis in the book to model Bitcoin’s future price. The best fit—by far—was a power function. The graphs shown are logarithmic; Bitcoin’s price appreciation has been—and may continue to be—logarithmic.
“Every 10-fold increase in Bitcoin’s Stock-to-Flow ratio, which will happen every ~12 years going forward, has produced a ~1,000-fold increase in Bitcoin’s price. And that hasn’t happened once, but twice.”
Steiner explains that he has yet to see another asset behave this way, even after a multi-decade career on both the buyside and sell-side of Wall Street covering Financials, Housing, and Macro.
In the spirit of full transparency, Steiner isn’t keeping his model a secret. The equation for the theoretical progression of Bitcoin’s price (relative to its Stock-to-Flow) is y=1.3268x2.4769.
That equation forecasts Bitcoin to hit $1 million by the latter half of 2020s, and $10 million per BTC by the late 2030s.

Of course, Stock-to-Flow is not the only factor that will influence cryptocurrency prices going forward. The goal of the model is to prove how Bitcoin intrinsically could achieve these price levels.
Furthermore, not everyone plans to be a long-term holder of cryptocurrencies. Many people use crypto in various transactions, or to store value but later realize a gain, among numerous other use-cases.
Hedgeye’s aim is to add a quantitative framework for investing in cryptocurrencies, for both short-duration traders and long-duration investors alike.
Investors can now gain a better understanding of the short-term and long-term movements and correlations that alter the near-term trajectory for various cryptocurrencies and crypto-related ETFs. In other words, Hedgeye is injecting transparency into what will presumably be a massive asset class which one day could rival equities, fixed income and foreign exchange.
The Bitcoin Trend Tracker does exactly that.
As a risk management tool, it focuses on the Price, Volume, Volatility, and correlative characteristics of each asset it tracks. Managed by the Hedgeye Macro team, it continues to evolve based on new models they develop, subscriber feedback, and innovations within crypto.
Hedgeye’s Bitcoin Trend Tracker includes Hedgeye CEO Keith McCullough’s proprietary, buy low, sell high Risk Ranges for Bitcoin, Ethereum, the Grayscale Bitcoin Trust (GBTC) and Microstrategy (MSTR)… in addition to other critical crypto quantitative risk management data you can’t get anywhere else.
Recently, Hedgeye expanded its crypto coverage with proprietary Risk Ranges for the Amplify Transformational Data Sharing ETF (BLOK).
BOTTOM LINE: You can now get access to critical crypto risk management signals with the “Bitcoin Trend Tracker.”
Get more info on Hedgeye’s Bitcoin Trend Tracker here.
Learn more about Hedgeye’s overall investment research process here.
This is a sponsored post. Learn how to reach our audience here. Read disclaimer below.


