Mastering Channel Down Trading Patterns in Crypto Markets: A Comprehensive Guide

The post Mastering Channel Down Trading Patterns in Crypto Markets: A Comprehensive Guide appeared first on Coinpedia Fintech News
Traders frequently come across the Channel Down pattern, identifiable by a downward-slanting channel evident on price charts. Proficiency in recognizing and leveraging this pattern can offer valuable insights into market trends and potential trading prospects.
Recognizing Channel Down Pattern:
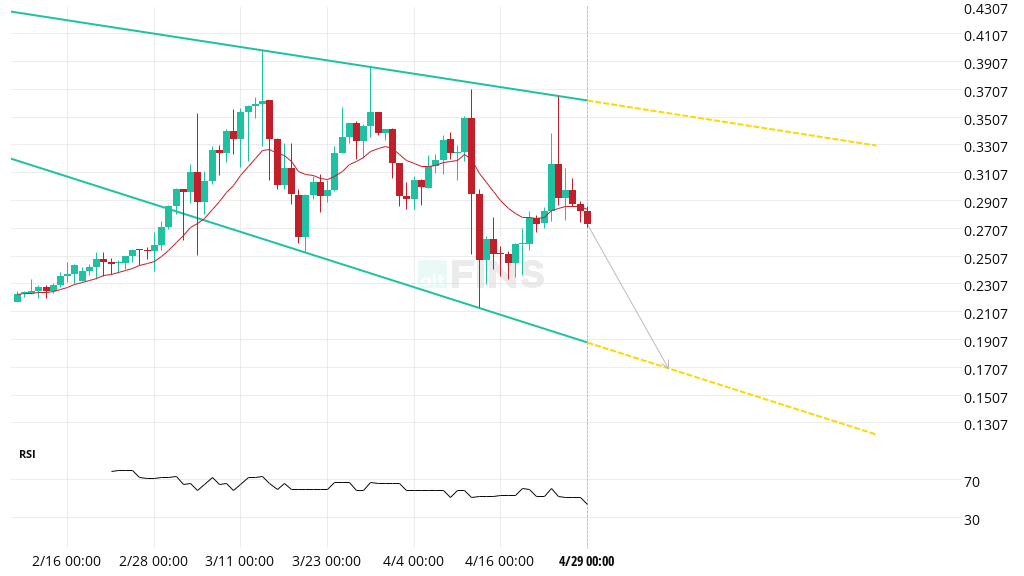
Channel Down pattern manifests as a downward-sloping channel on a price chart, indicating a consistent decline in the asset’s value over time. Traders typically identify this pattern by drawing trendlines that connect the lower highs and lower lows of the price movements. The upper boundary represents the peak prices, while the lower boundary acts as a level of support, preventing further decline.

Trading Strategies for Channel Down Patterns:
- Entering Short Positions: Traders may consider entering short positions when the price gets rejected at the upper boundary of the channel (see example in above chart). This indicates a potential continuation of the downward trend.
- Entering Long Positions: Conversely, traders may look for opportunities to enter long positions when the price nears the lower boundary of the channel. This suggests a possible bounce-back as demand from buyers picks up.
- Trading Breakouts: Breakouts occur when the price breaches the trendlines of the channel, signaling a potential shift in market sentiment. Traders can initiate trades based on confirmed breakouts, accompanied by significant volume and supported by technical indicators like moving averages, RSI, and Bollinger Bands.
Learn How to Trade Channel Down Pattern
altFINS Crypto Trading course provides beginner and intermediate traders with essential knowledge of trading chart patterns. Lesson 8 covers everything about Chart Patterns, making it an essential part of the curriculum for those aiming to enhance their trading skills:
1. Emerging vs. Breakout chart patterns.
2. When to exit a pattern trade?
3. Pattern Types and success rates.
4. Where to find chart pattern trade setups?
Utilizing altFINS for Channel Down Trading:
altFINS provides traders with a powerful platform to identify and analyze 26 chart patterns, including Channel Down patterns. By leveraging altFINS’ Chart Patterns section and Technical Analysis section, traders can filter for specific pattern types and stages, such as Channel Down Breakouts, to uncover potential trading opportunities efficiently. With access to 26 automated chart patterns, traders can streamline their analysis and make well-informed decisions in the crypto market.


