Never Bet Against an Underlying Bid
Summary
We continue to believe that odds favor our short term target out of the pennant at 24,450 will be hit and only a lower low would start to put that technical thesis in jeopardy.
After a brief pull back to the break out point of the triangulating price pattern (23,110 now marks short term support), prices overtook yesterday’s highs. The Slow Stochastic has held above the 50 level since the mid-December “lift off” and has turned higher again through its signal line.
Our longer term target of 24,700 remains unchanged.
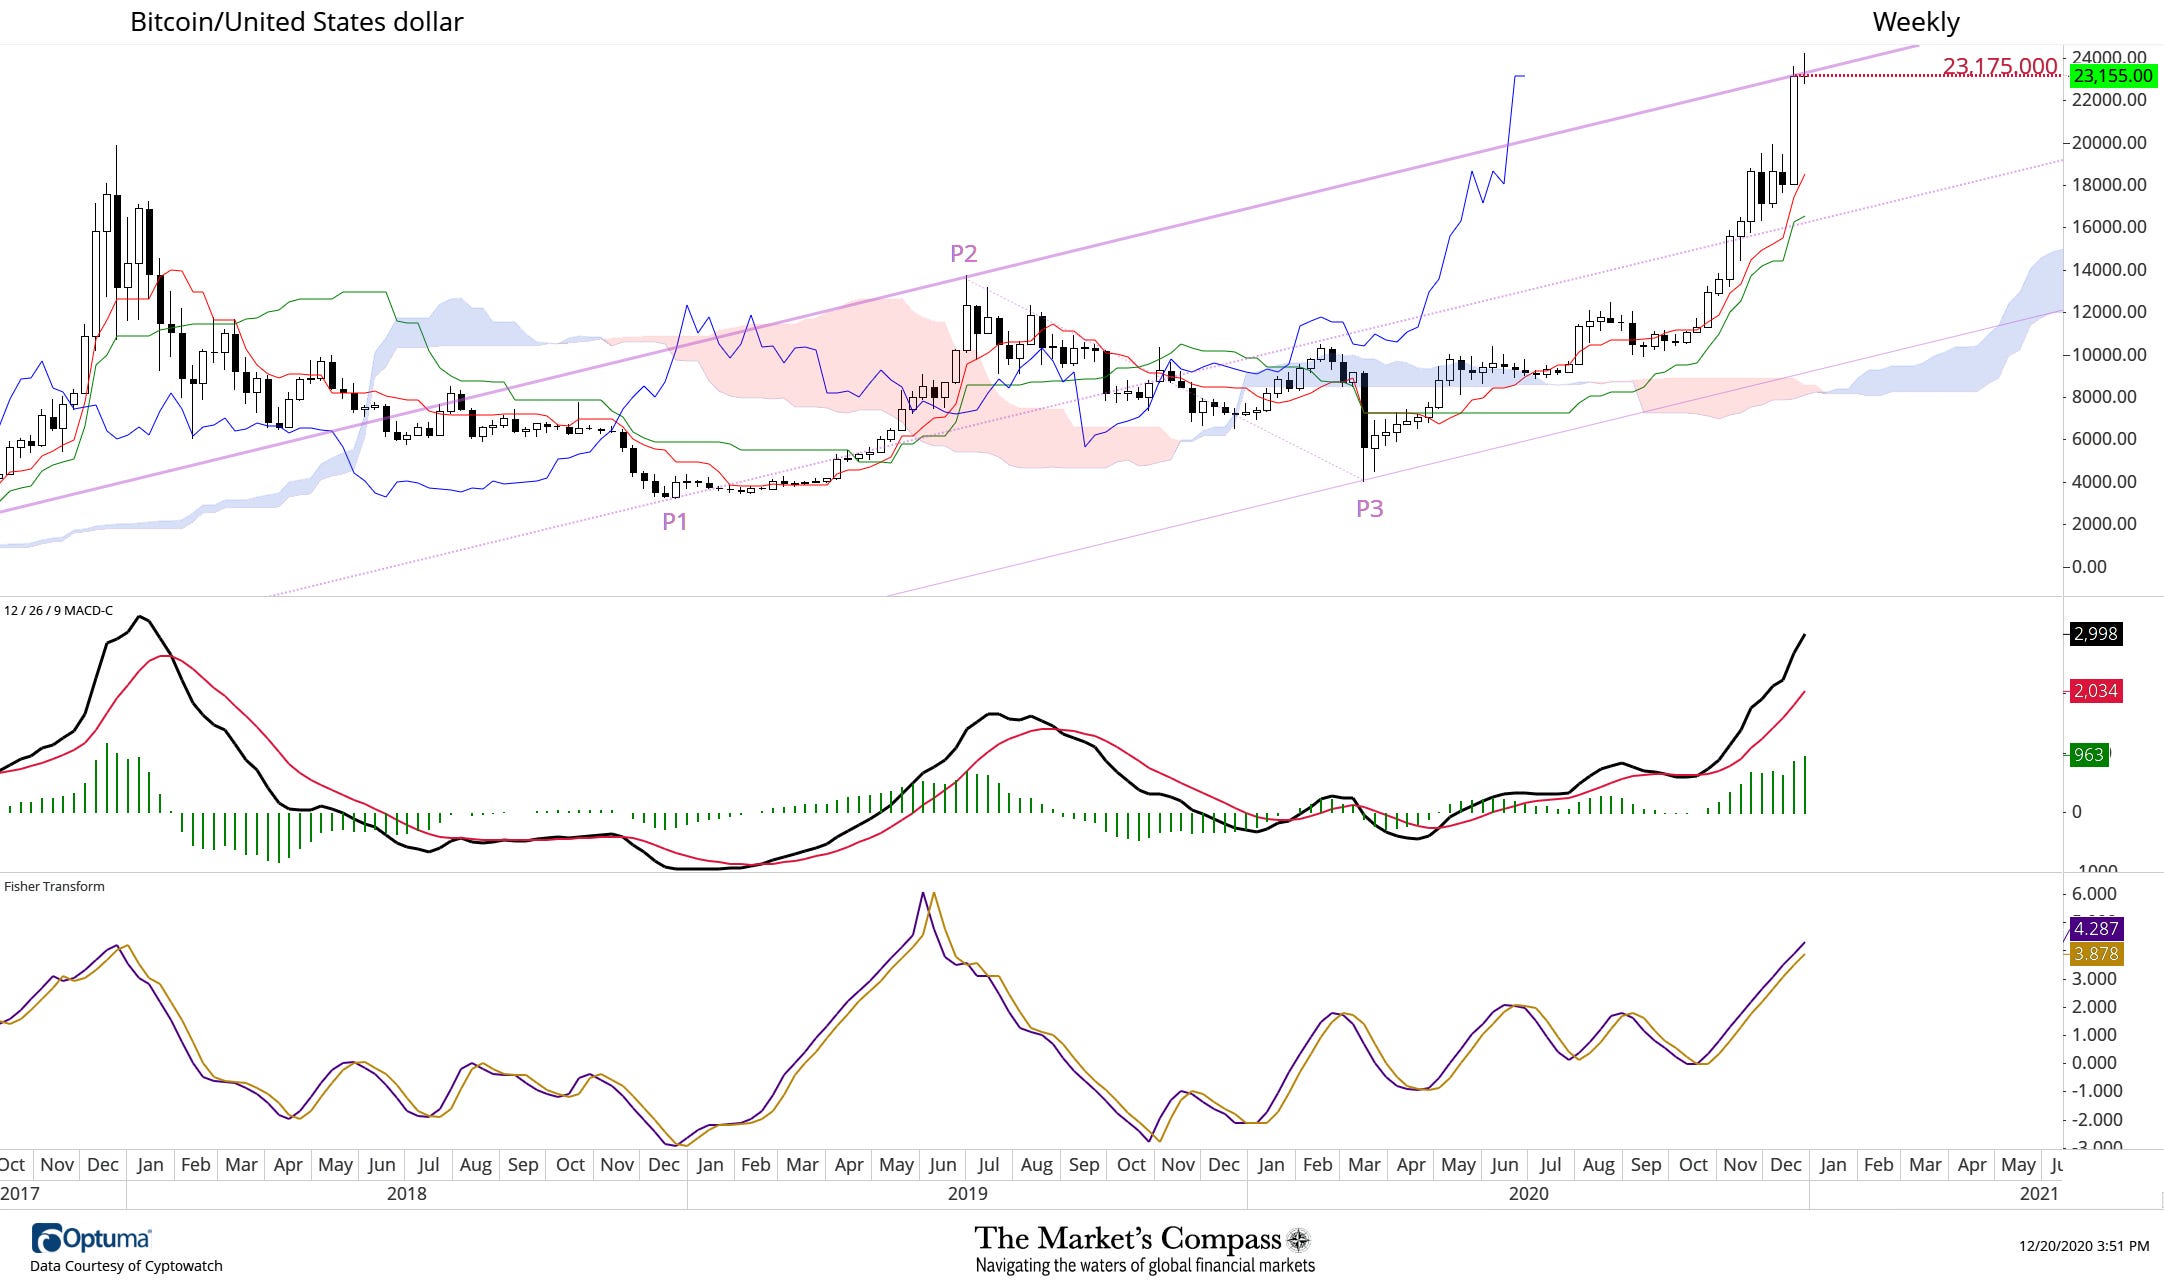
Weekly / Bitcoin
Prices broke out above the Upper Parallel of the Standard Pitchfork (solid purple line) but have pulled back into the confines of the Pitchfork. Weekly MACD continues to charge higher reflecting strong upside price momentum and is confirmed by the Fisher Transform.
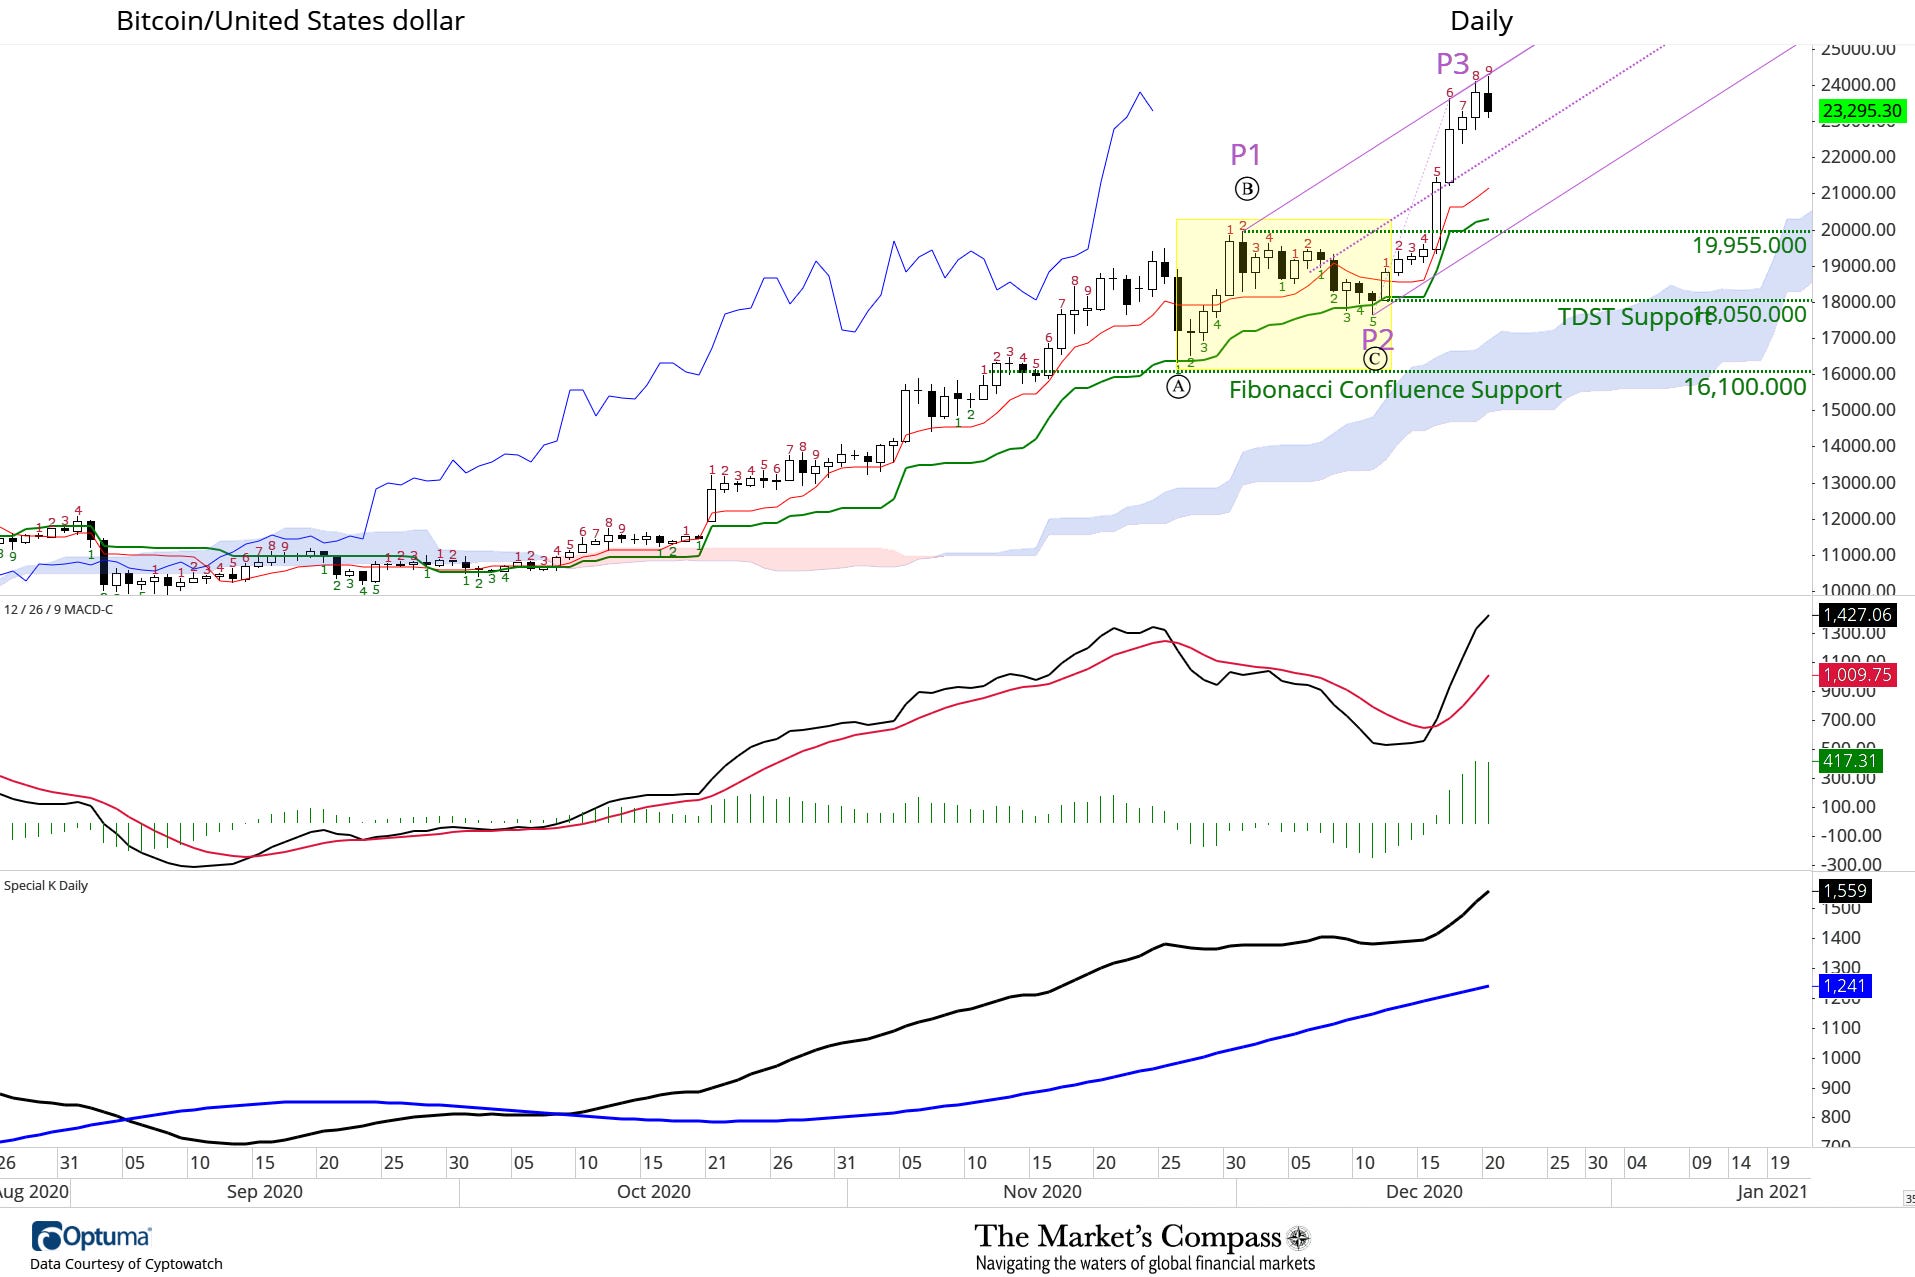
Daily / Bitcoin
For the second day in a row Bitcoin is challenging the Upper Parallel of the newly drawn Schiff Modified Pitchfork. The underlying strength is visible upon inspection of the higher lows in the lower shadows of the candle sticks since Friday, which is well above Median Line support (purple dotted line).
The is no hint of a slowing of upside momentum in Daily MACD which is widening the gap above its signal line. Martin Pring’s Special K (a momentum indicator that combines short, intermediate and long-term trends in one indicator) is also peeling away from it signal line. At the time of this post, today’s candle is sporting a lower close a but by no means does it suggest the death knell of the rally.
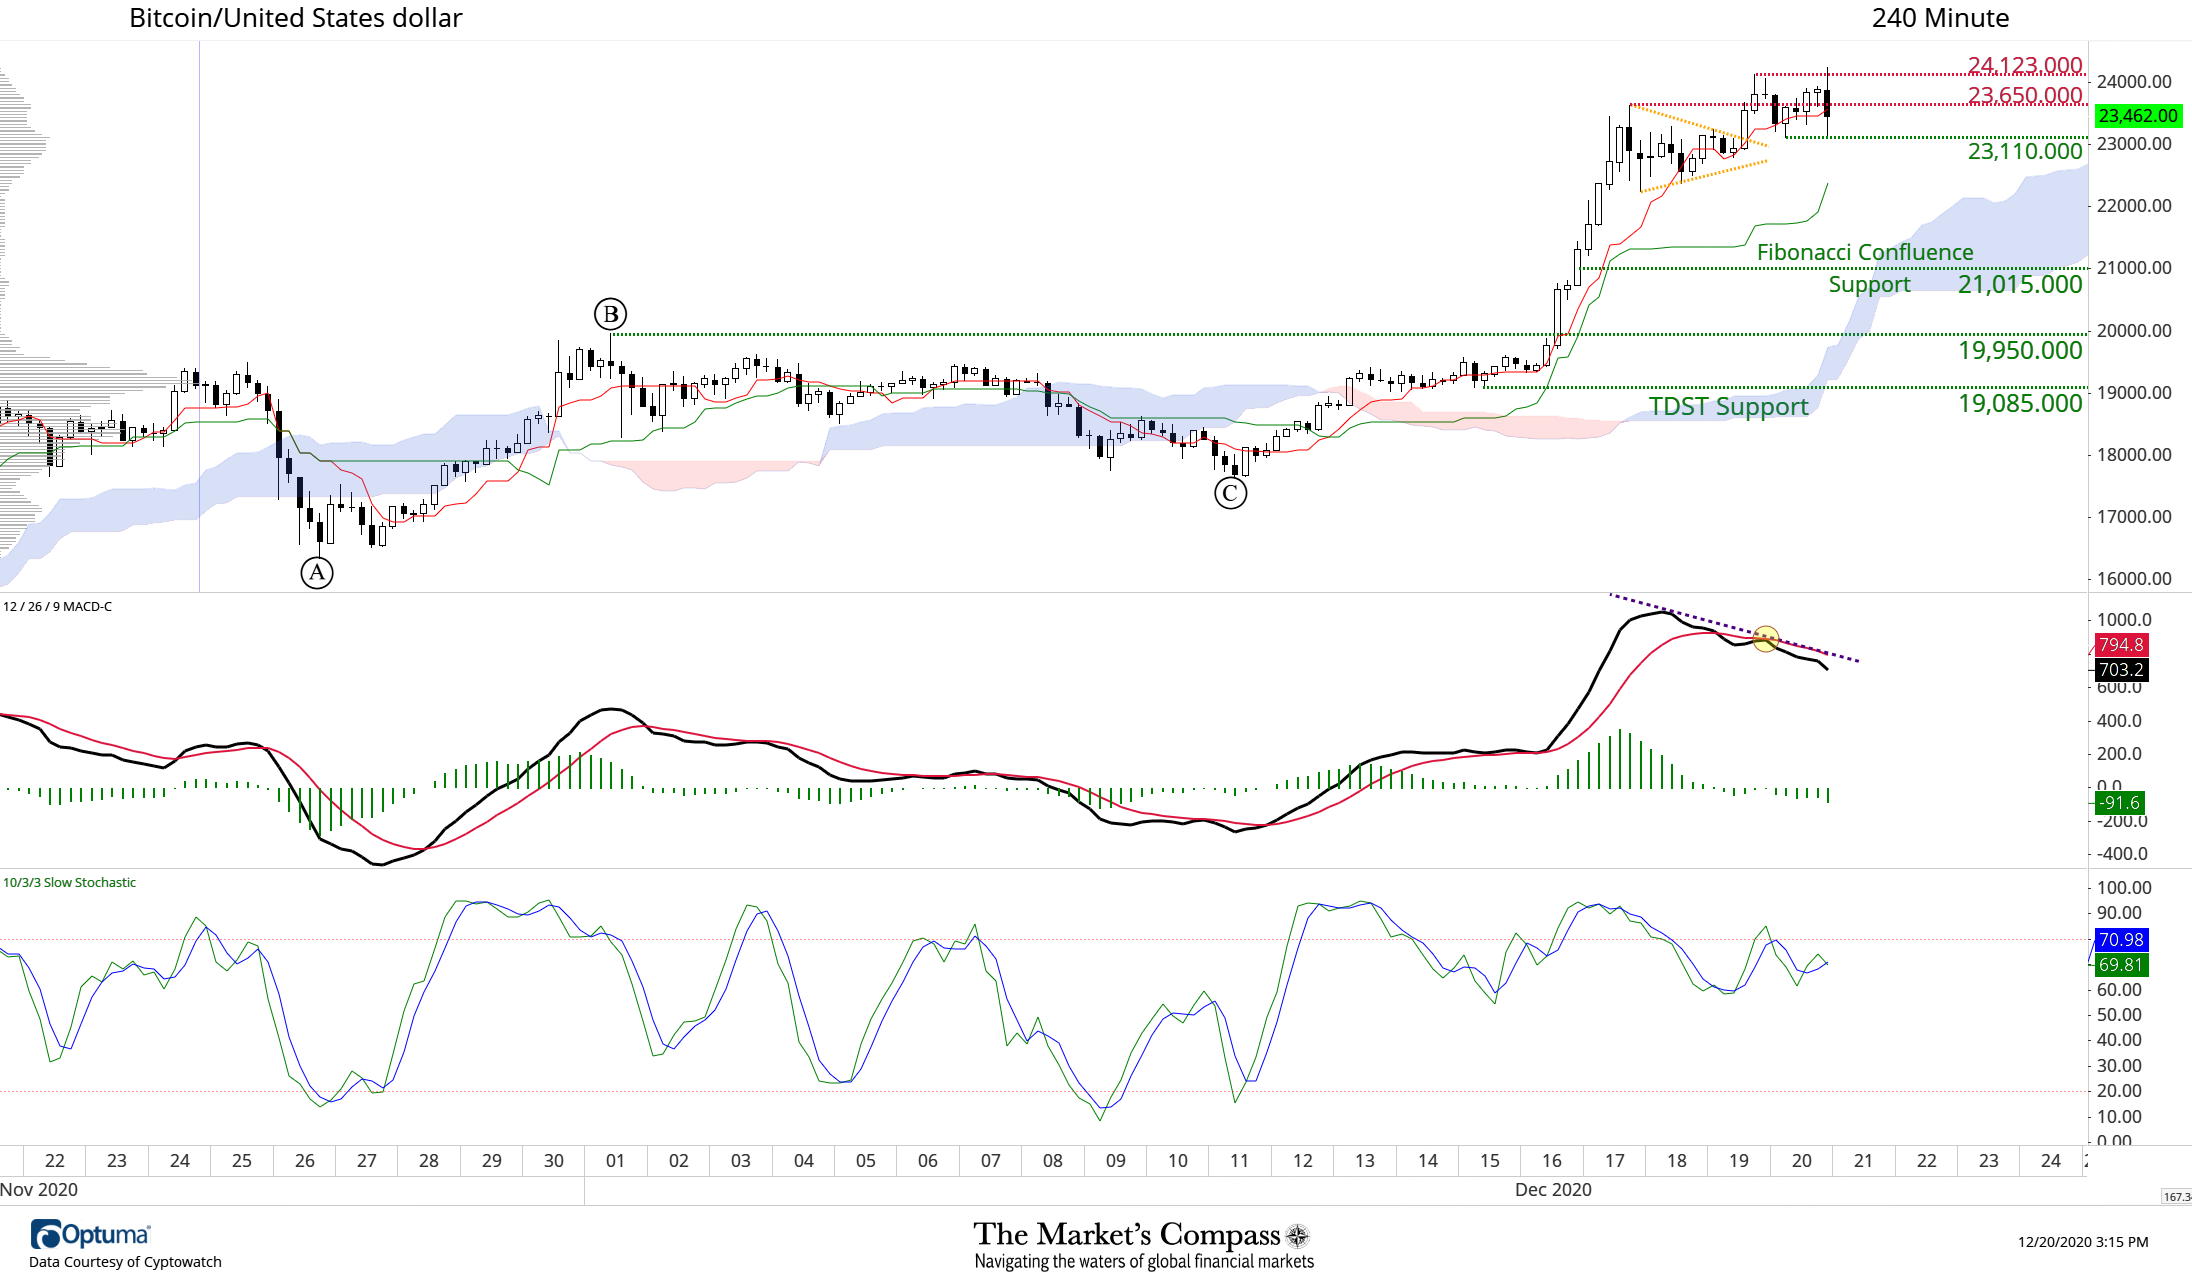
240-Minute /Bitcoin
After a brief pull back to the breakout point of the triangulating price pattern at 23,110, prices traded above yesterday’s highs (we now mark that level as short term support). That level was tested again in the last four hours and held. The Slow Stochastic has held above the 50 level since mid-December “lift off” .
Our only technical concern is the non-confirmation and lower high in MACD (purple dashed line) visible when prices rose to a new high.Although it remains in elevated territory, it has been unable to retake the ground above its signal line (yellow circle).
Hourly / Bitcoin
Bitcoin fell below Cloud support during the last two hours but is attempting to recover, but the Median Line of the newly drawn Schiff Pitchfork (purple dotted line) has capped the recovery. Hourly MACD was tracking back above its signal line (yellow circle) but has fallen back below it. Key support at the bottom of the Cloud should be watched.
Conclusion
Higher time frames are still in gear to see higher prices, but the current shorter term price action suggests there is further need of price gain digestion.
Resources and Learning
To learn more about constructing the three variations of Andrews Pitchfork check out: https://www.optuma.com/pitchforks-part-2/
To try out Pitchforks and the other technical tools I utilize in my analysis, try an exclusive 30-day free trial of Optuma Charting Software: