Not for the Faint of Heart
Summary
I am going to start today’s piece by stating the following: during the +40-years that I have been either trading or analyzing the financial markets, only a handful of times have I seen extreme moves and volatility that we witnessed in Bitcoin and Ethereum over the past 48-hours, and those were primarily moves in commodities.
During the early morning hours of trading Sunday what had become an almost parabolic move in Bitcoin reached its denouement at 34,873. This now marks first resistance.
A reversal developed from that level, in what has unfolded thus far as a three wave counter trend pullback. Although it undoubtedly shook up the bulls, we do not see it as the death kneel of the epic rally in Bitcoin. We view it as a constructive but admittedly nasty pullback.
As can be gleaned from the multi-time frame analysis below, there are a number of support levels that should serve as pivots for the resumption of the rally.
Only a break of price support at 27,560 and Cloud support at and 28,000 would suggest a larger degree correction was unfolding.
A break in price support at 27,560 and Cloud support at 28,000, would suggest a larger degree correction is unfolding.
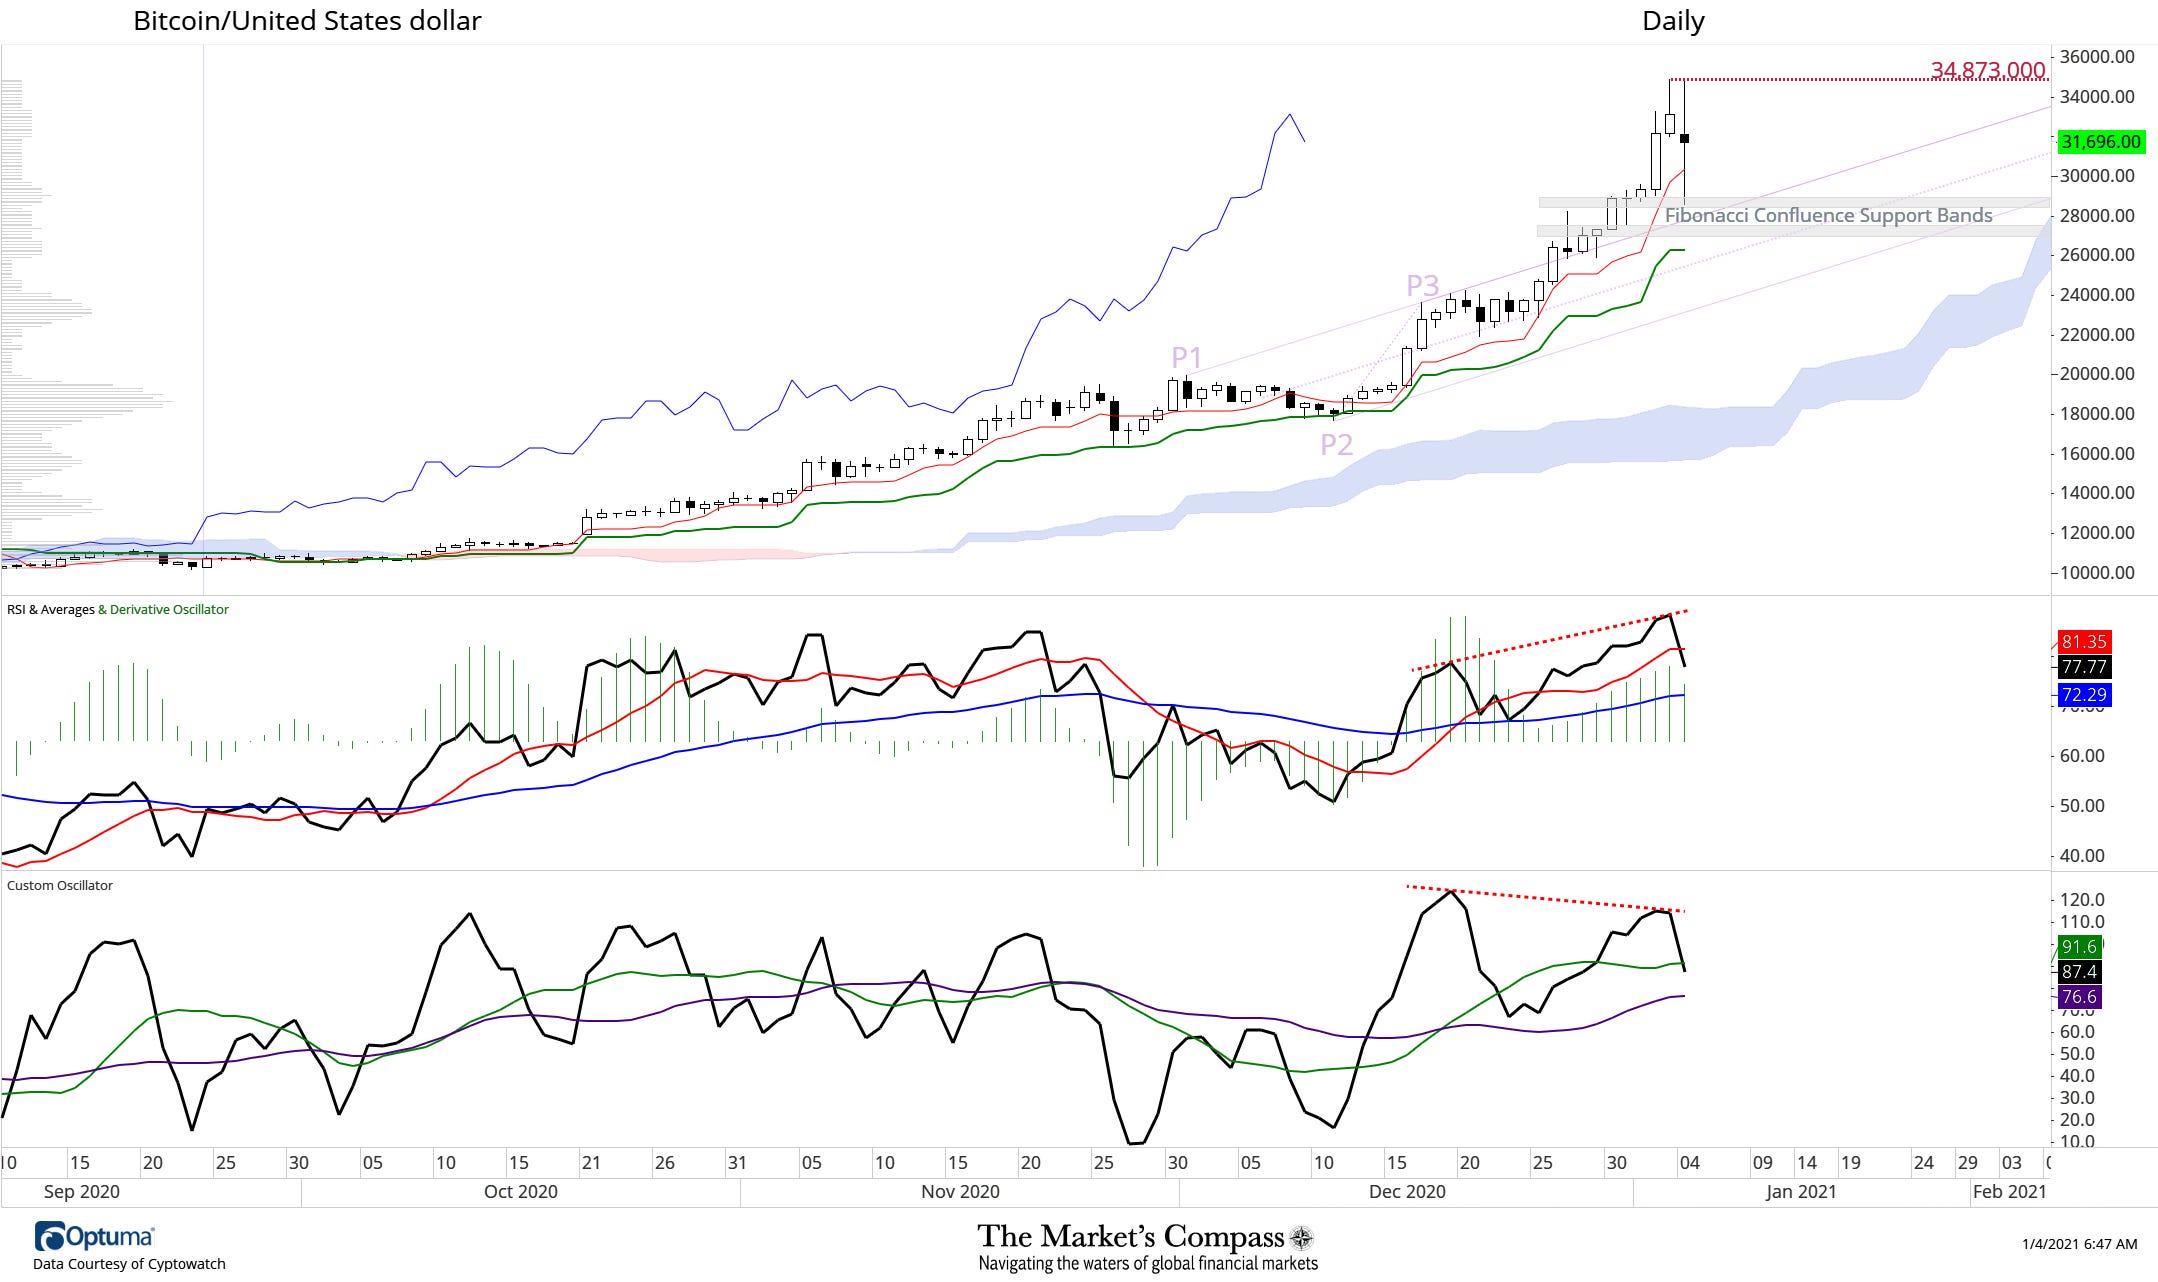
Daily Time Frame
The daily time frame chart of Bitcoin reveals that it had run “too far too fast”. There were two clues revealed by the momentum oscillators that the advance was running out of steam.
Although RSI blew out to new highs (signaling that a third wave was developing), the Custom Index failed to confirm those highs (red dashed lines) and the Derivative Oscillator printed a lower high (green horizontal lines).
The price pullback has thus far has found support at the higher Fibonacci retracement confluence support band and the Upper Parallel of the Schiff Modified Pitchfork. As a result, a measurable bounce has unfolded.
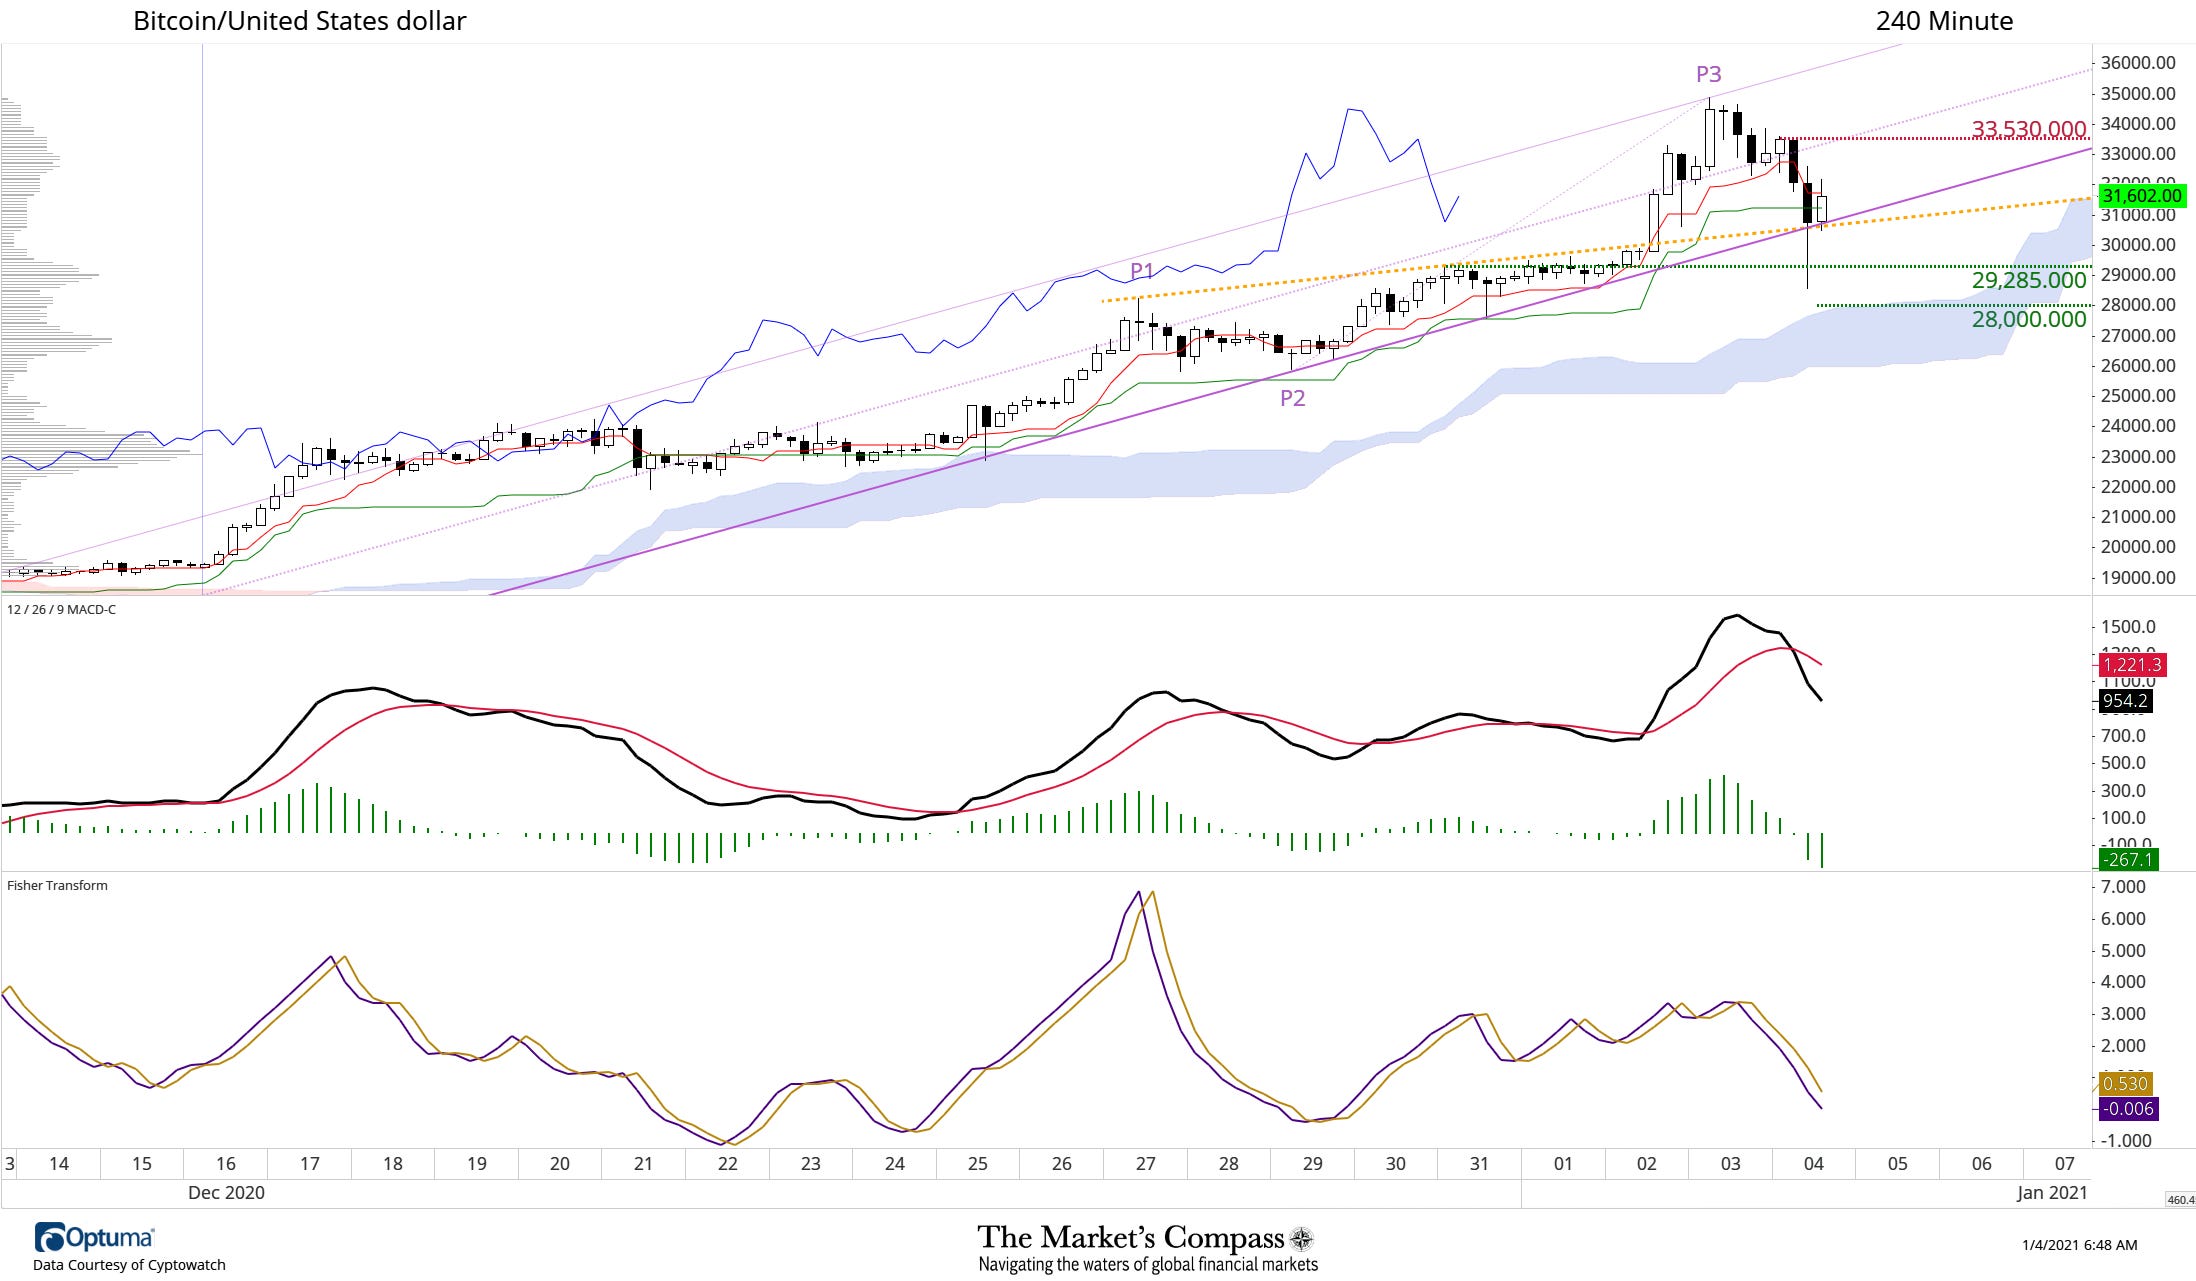
240-Minute Time Frame
In a Twitter post during the initial pullback prior to the highs at P3 we suggested that only a break on a closing basis of the rising trend line of the previous break out level (yellow dashed line) would suggest that a correction of a larger degree was unfolding. Although the selloff accelerated and overshot that level, it recovered to close back above there and has remained contained in the newly drawn Schiff Pitchfork (purple P1 though P3) on a closing basis as well.
A rally and close above the 33,530 level would suggest that the 3-wave corrective pullback had run its course and that it will not become more complex in price and length of time.
Only a break below Cloud support in and around the 28,000 level would change our technical thesis.
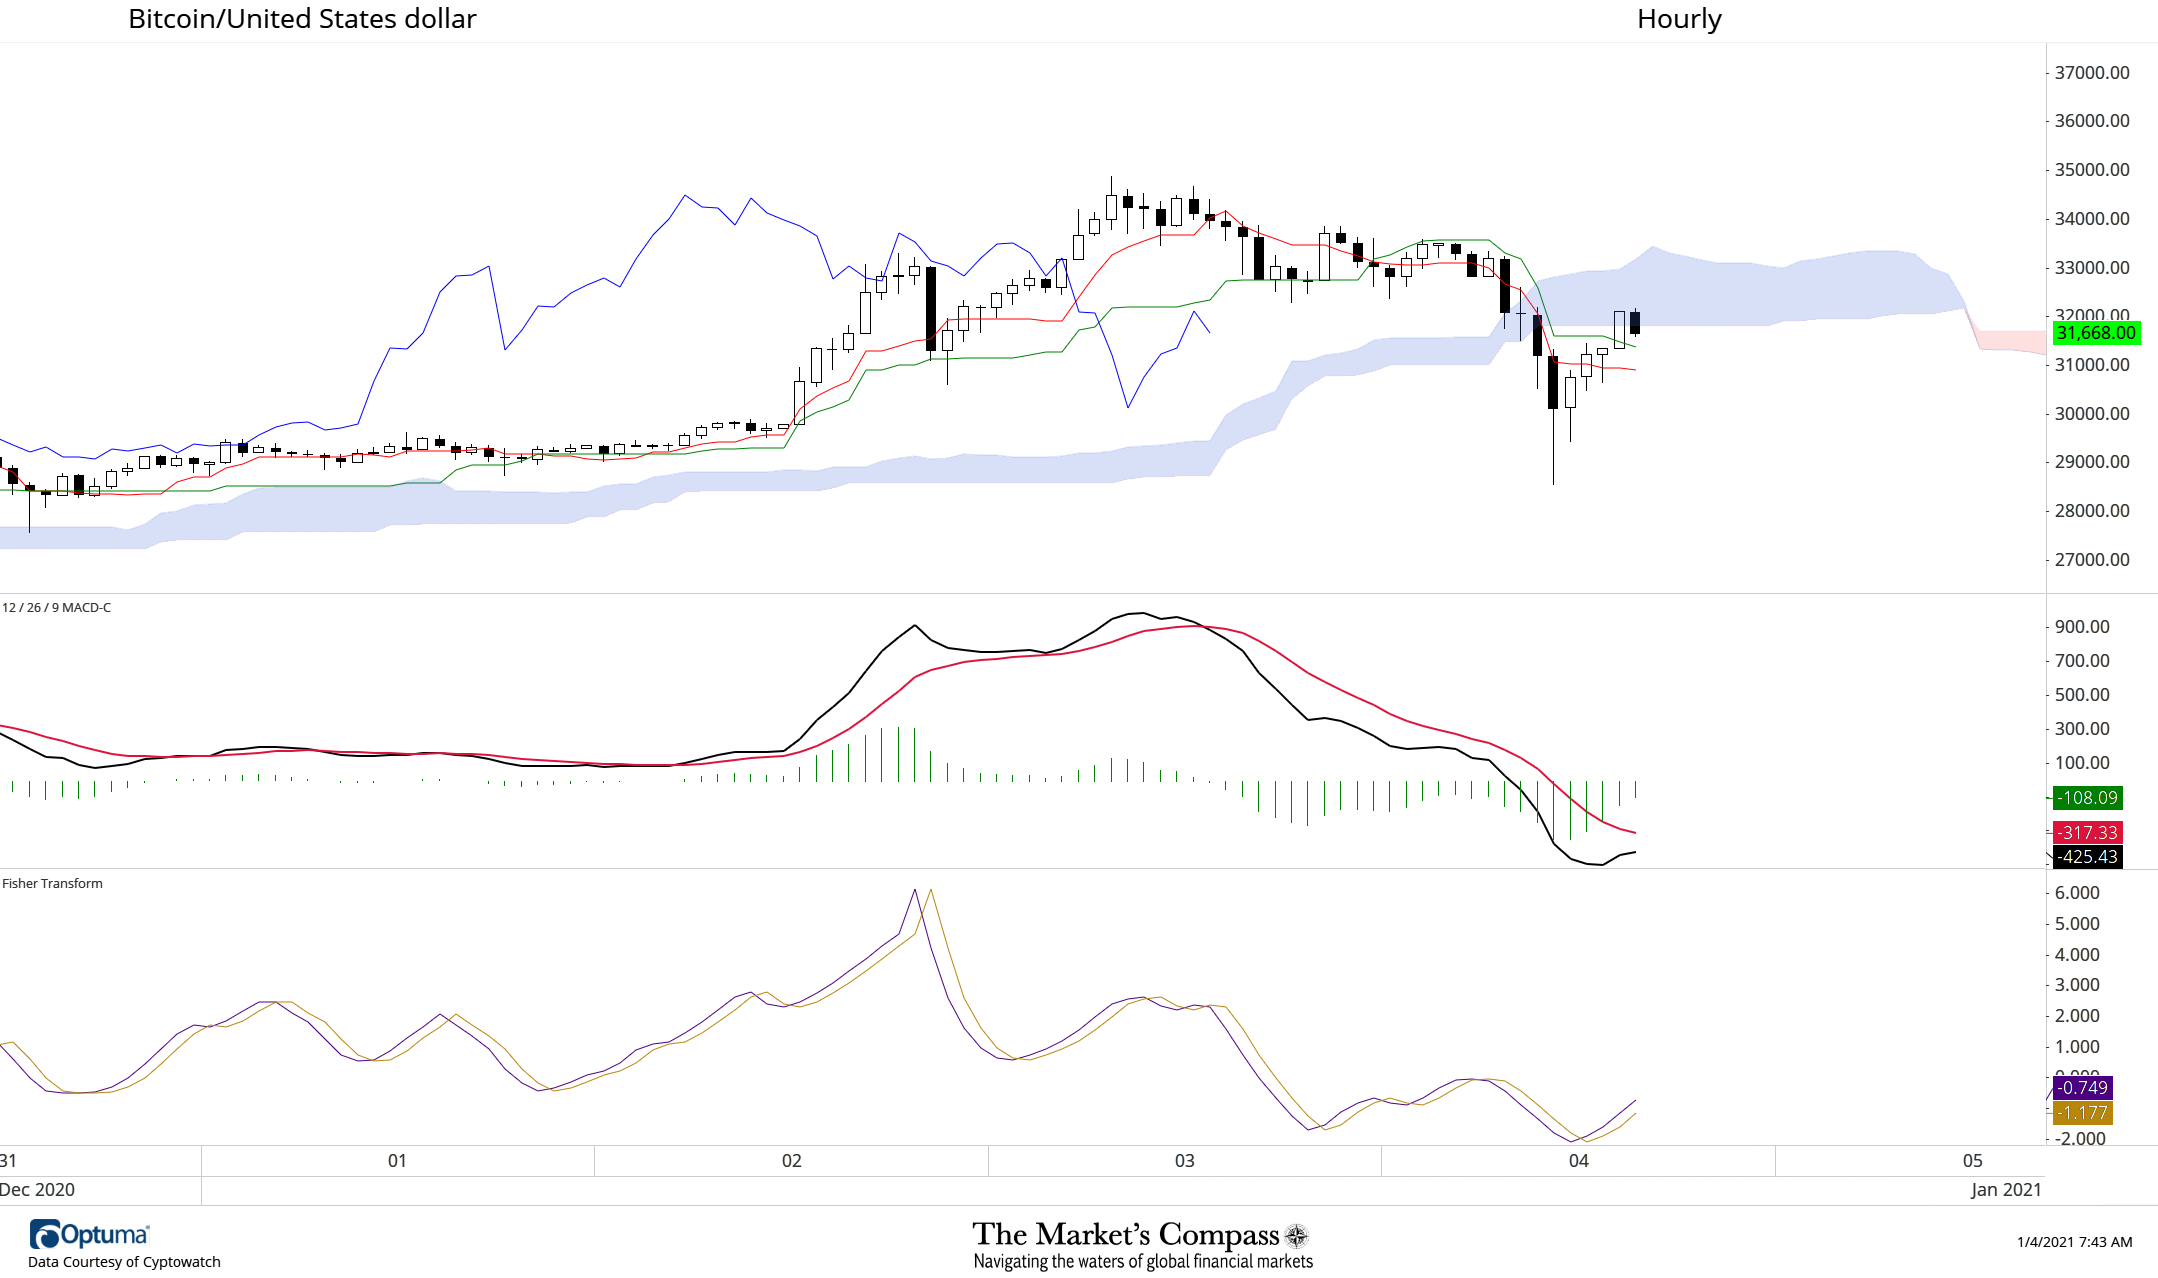
60-Minute Time Frame
For the first time since last Tuesday, Bitcion fell through and is now trading below the Hourly Cloud and has not been able to retake the ground above it.
That being said, there is an early hint that it may be able to do so. In the short term, MACD is starting to hook higher, but remains in negative territory. The turn in the Fisher Transform is suggesting that it may be able to do so.
Resources and Learning
To learn more about the tools I use to develop my technical theses in crypto currencies and other financial markets, follow the link below for a brief tutorial.
The tutorial is titled “Tools of Technical Analysis” and is a three part Pitchfork series co-authored with Kyle Crystal of Lakeshore Technical Analysis.
https://www.themarketscompass.com
Follow the link below for an exclusive 30-day free trial of Optuma’s Charting Sortware: