Patience is the Key
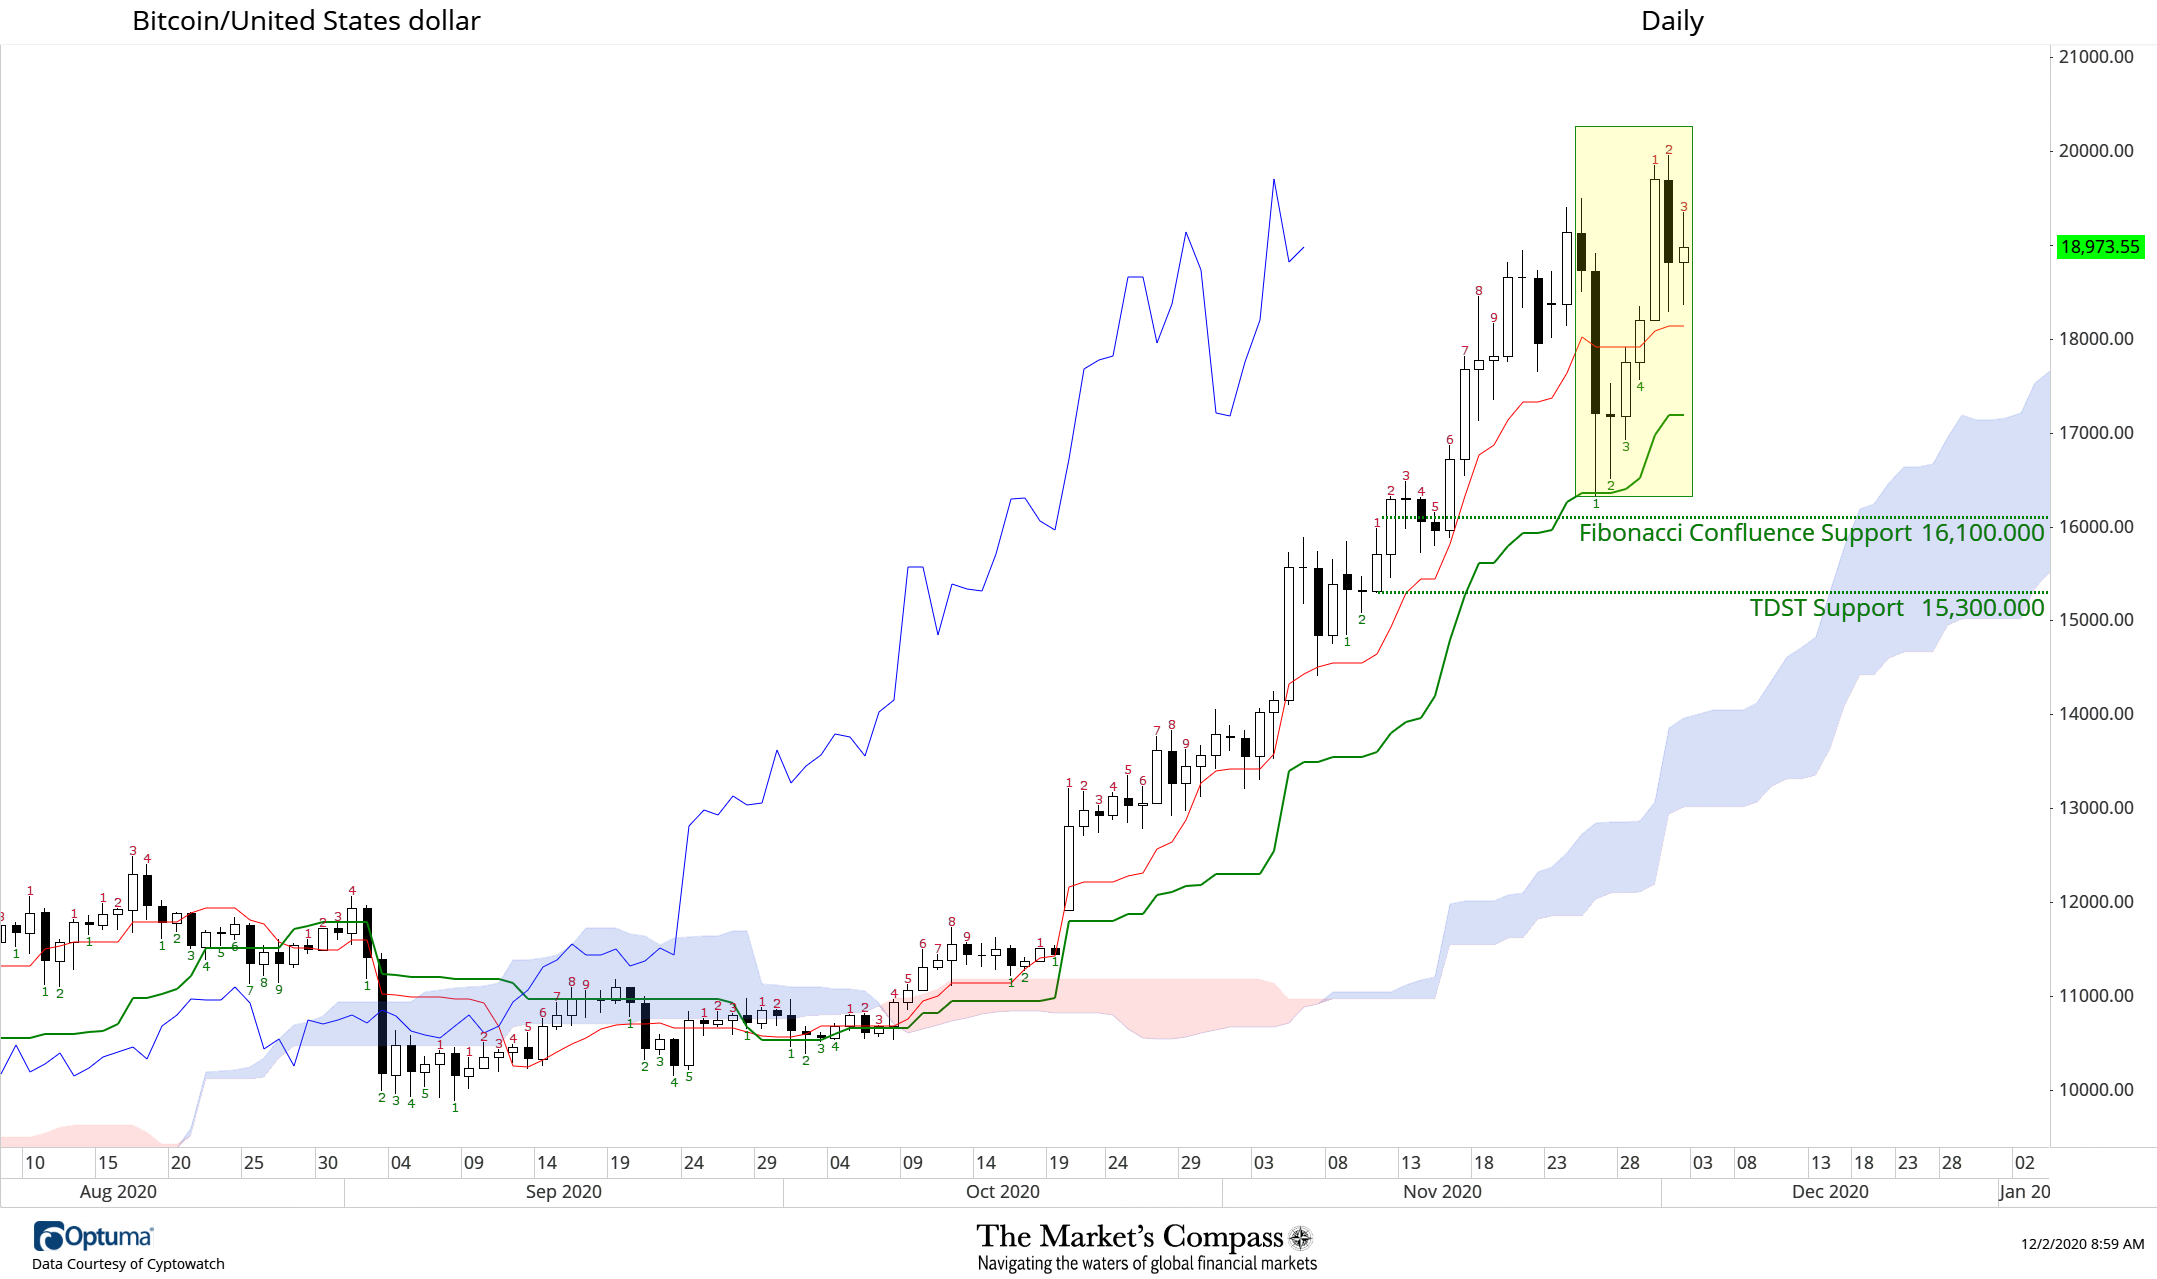
Summary… Despite registering a new recovery high this week after last week’s pre-Thanksgiving Day Massacre we still believe we are currently embroiled in a rolling correction (see yellow rectangle on daily chart) and only a strong rally above Tuesday’s high at 19,954 would alter that technical thesis and thus suggest that the correction had run its course. The Median Line and Kijun Sen (green solid line) of our newly drawn Schiff Pitchfork (P1 through P3)on the 240-minute chart has twice held as support (green arrows) suggesting that there remains a measurably higher underlying bid and support at the top of the Cloud that has not been challenged. We now mark short term support at 18,290, second key support at 16,810, and 16,000 at the Price Activity Support Band.

What Happened at the Previous Record High…
We were not at all surprised that the l recovery rally in Bitcoin ran into trouble at and around the 20,000 level as we had always viewed it as potential “Bag Holder” resistance for some time. Adding to the difficultly in surmounting that level was that Bitcoin had gotten a little ahead of itself since the rally from the September lows and was due for some more extensive “backing and filling”.
Elliott Wave Theory and the Longer Term Technical Picture…
One of the knocks against Elliott Wave Analysis is that there it is highly subjective and how different technicians count the wave structure (despite that there are clear rules and guidelines) and the other is that there is always what is referred to as an “alternate count” (if it is not this than it is this) that is often is presented with the preferred count.
We have witnessed hundreds of examples of the incorrect labeling of wave counts by those who have only a cursory knowledge of the “theory”. We nonetheless have studied and utilized Elliott Wave Theory for 30 years and find it an invaluable tool and indispensable one in our tool box, but no technical tool should be used in a vacuum and the weight of the evidence approach is our modus operandi. This also includes multiple time frame analysis as well. It is important to back out to higher time frames to be certain that the longer term picture has not changed.
We still believe that we are in a 5 Wave impulsive rally in Bitcoin that began at the March lows this year (for reference the pivot low at P3). That is our preferred count. When the oscillators blew out to new highs (yellow dotted lines) it gave us confidence that Bitcoin was in the throes of an unfolding 3rd Wave of an unfolding larger 5 Wave impulsive rally. In our post titled Multi-Time Frame Bitcoin Study https://themarketscompass.substack.com/p/multi-time-frame-bitcoin-study we suggested that if 14,550 was likely the center of the Wave 3 of the longer term rally and wrote “If that is indeed the center, then Wave (3) could easily reach 19,165 on a measured move before a lesser degree wave 4 develops.”
Bitcoin overshot that level but what we continue to believe is that what we are witnessing in the short term is a developing 4th wave of a lesser degree with much higher prices ahead. If 14,550 is indeed the center, next year’s target of 24,000 (as farfetched for some to believe) would be the “Uber” bullish target after a price retracement of a large degree unfolds.
Be prepared for increased volatility…
Remember …as my colleague Kyle Crystal says “In Price there is Truth”.