The Dethroned King Dollar
Summary
The only bullish feature that we can find regarding the DXY is the almost universal hatred that has been assigned to the USD. The Monthly, Weekly, Daily and the 240-Minute time frame charts all reflect deteriorating price momentum. When all time frames are in gear it’s hard to expect anything other than an oversold bounce.
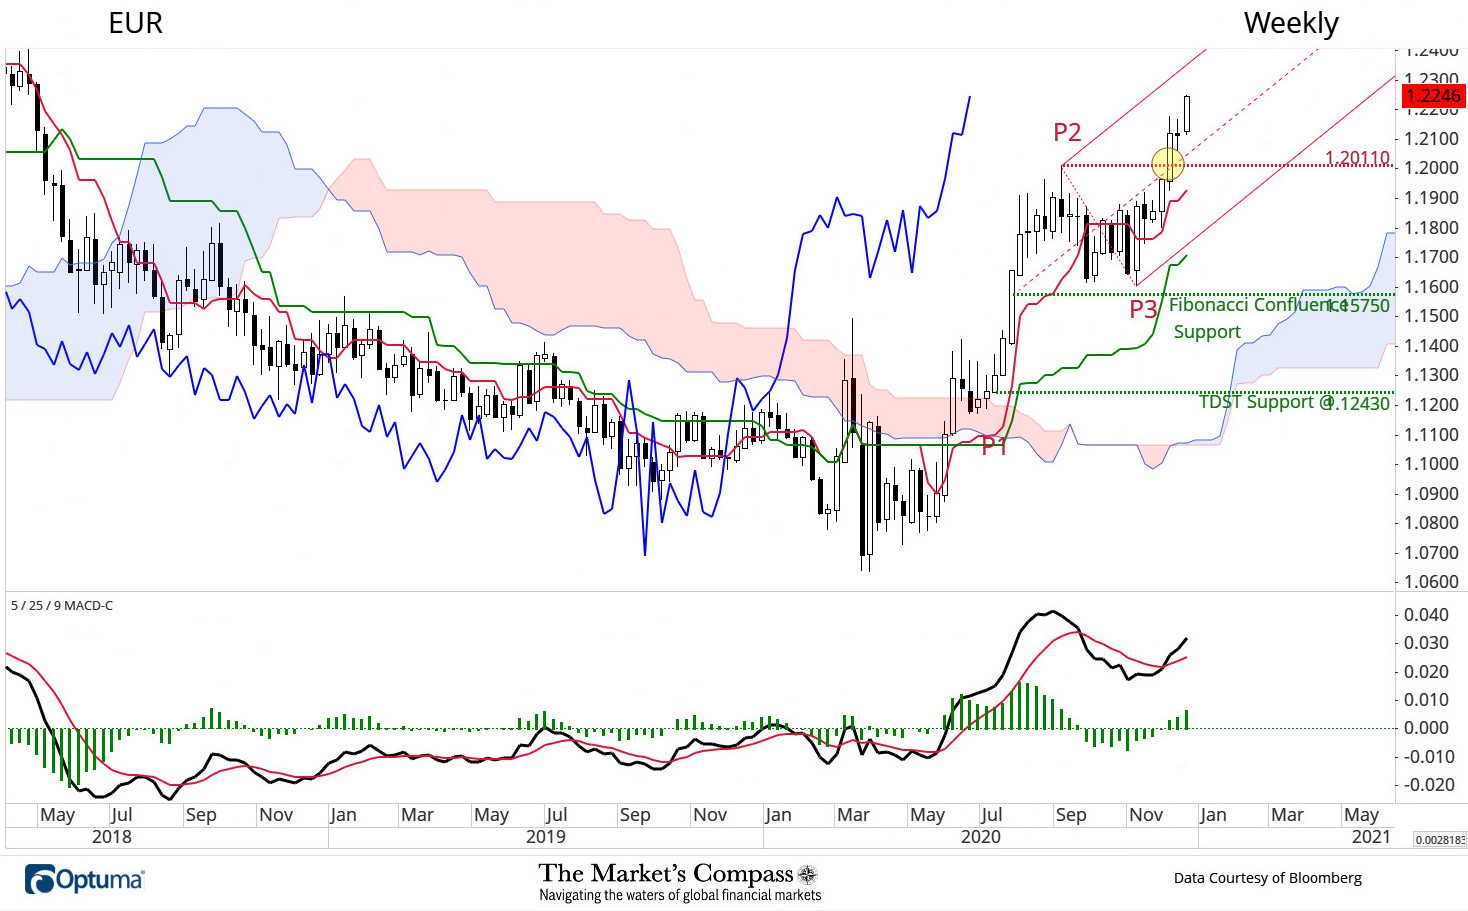
With the Euro (57.6% weighting in the DXY) approaching two year highs (chart below) after overtaking its September swing higher and the Median line Schiff Modified Pitchfork (yellow circle), it is hardly a surprise that the DXY has been under the pressure we have witnessed.
We continue to expect that support at the February 2018 lows in the DXY at 88.25 will be tested.
Monthly / DXY
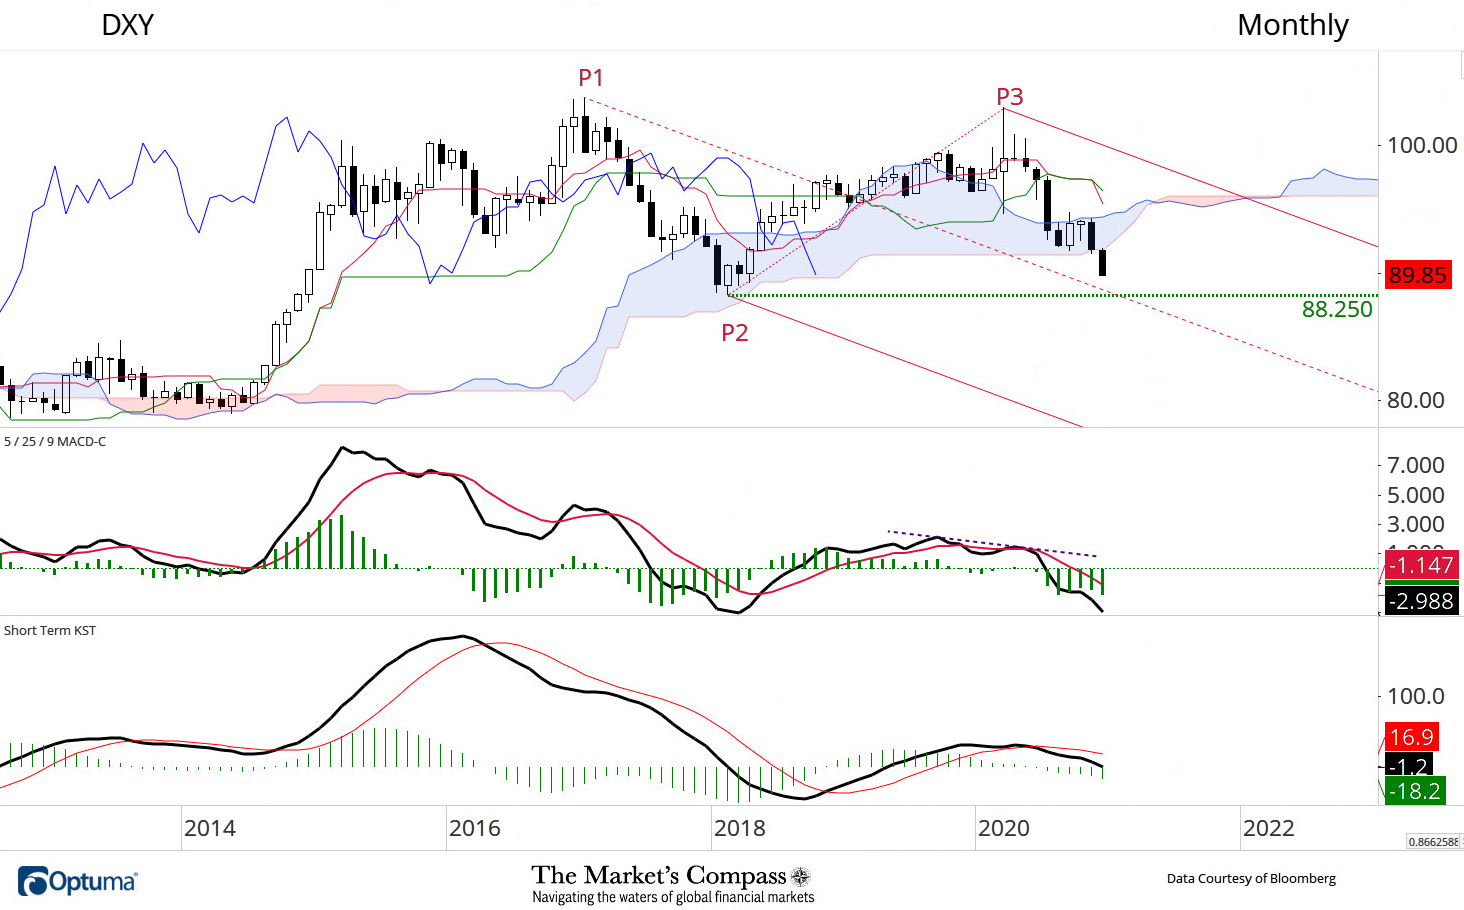
The DXY has fallen below the monthly Cloud for the first time in seven years. Back in March the failed attempt and reversal from the highs of the month gave birth to the Standard Pitchfork (red P1 through P3).
At that time MACD failed at a lower high (purple dashed line) and the momentum Oscillator has been falling since then, tracking lower in negative territory. Martin Pring’s KST, Know Sure Thing (lower panel), which is a summed and smoothed Rate of Change indicator of four different time frames fell through its signal in concert with the move in MACD acting as confirmation.
We continue to expect that at the very least, the support at the February 2018 lows in the DXY at 88.25 and the Median Line (red dashed line) of the above mentioned Standard Pitchfork will be tested.
Weekly / DXY
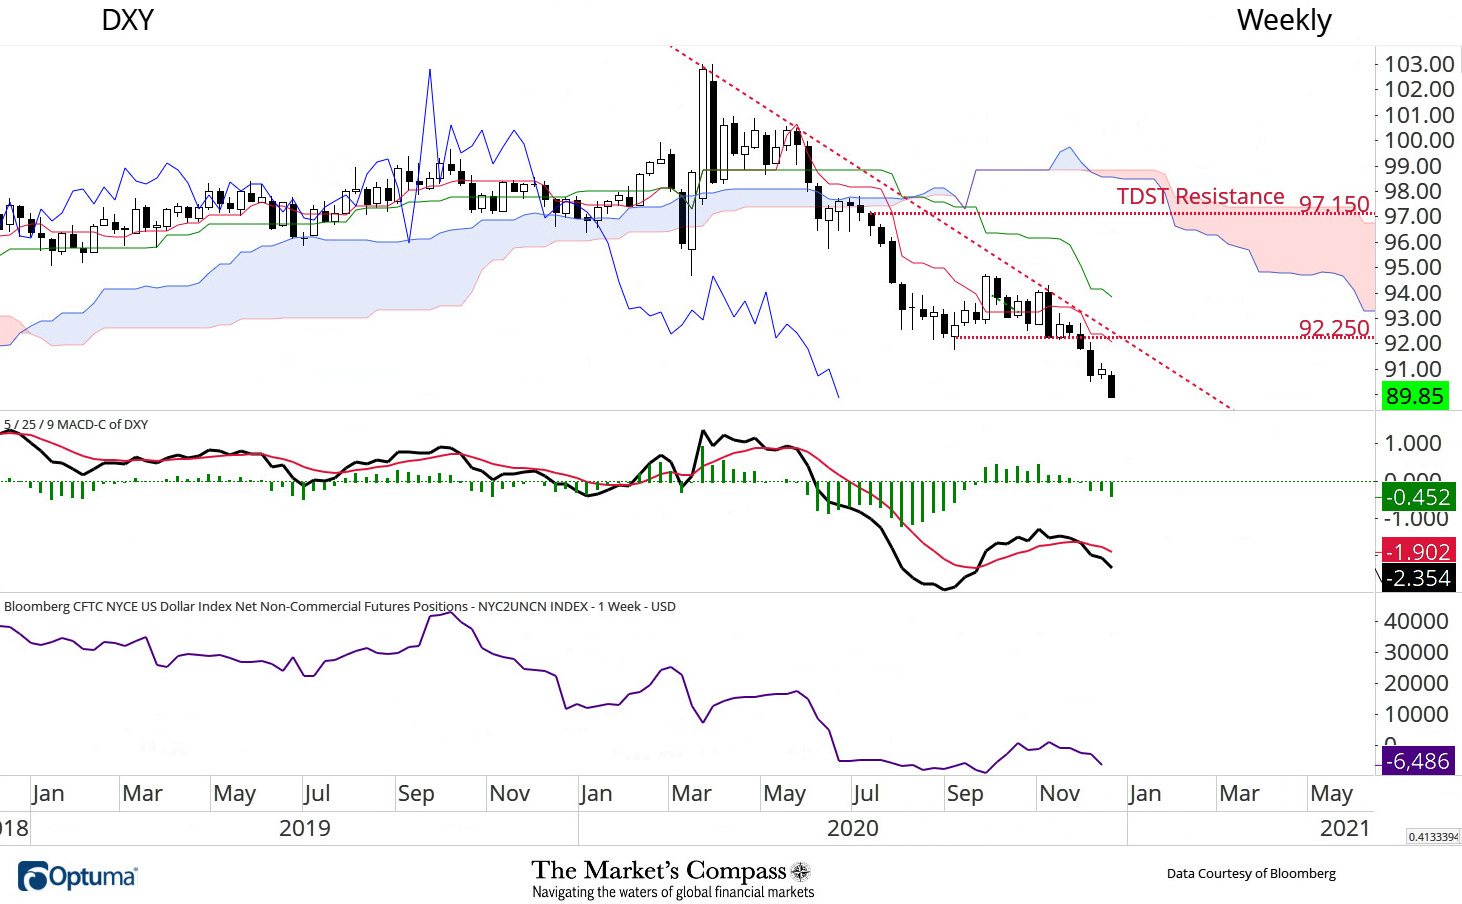
As mentioned in the Monthly Time Frame analysis, the DXY has been in a steady down trend (red dashed line) since last March. More recently temporary price support at the 92.25 level was violated four weeks ago and at the same time weekly MACD fell back below its signal line.
The added lower panel charts the weekly change in the CFTC reported NYCE US Dollar Index Net Non-Commercial Futures Positions. This number is released on Fridays based on numbers compiled earlier in the week. Last Friday’s Net Position was -6,486 contracts, just off the September lows. As we wrote in the summary this reflects a high level of negative sentiment towards the DXY. Although this may be considered to be “bullish fuel”, when the DXY turns higher we do not expect changes going into year end.
Daily / DXY
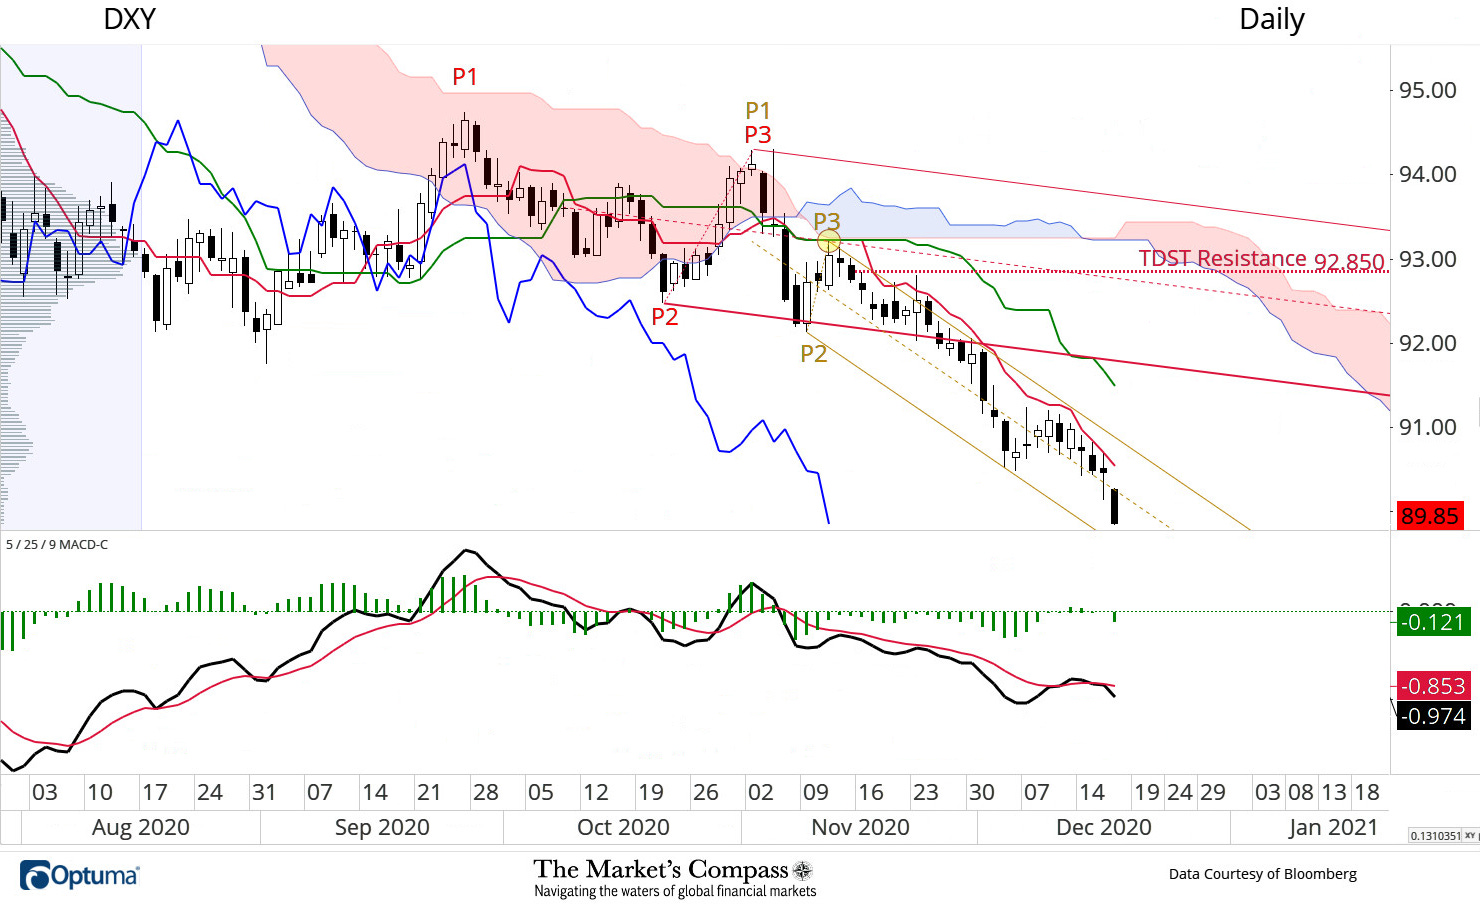
The DXY fell through the Lower Parallel of the Schiff Modified Pitchfork (red P1 through P3) during the last few trading sessions of November. It failed to retake the ground above it and has accelerated lower. The break of the Lower Parallel (heavy red line) gave birth to the newly drawn shorter term Schiff Pitchfork (gold P1 through P3) which for all intents and purposes has confined prices since then.
MACD briefly traded back above its signal line, but is tracking lower again in negative territory putting it in gear with both higher time frames.
DXY / 240 Minute
The DXY has been trapped under the 240-Minute Cloud since early November and more recently is trending lower under both the Kijun and Tenkan Plots (green and red lines respectively).
MACD is tracking lower in negative territory unable to retake the ground above its signal line and confirmed by the series of lower highs in the Fisher Transform.
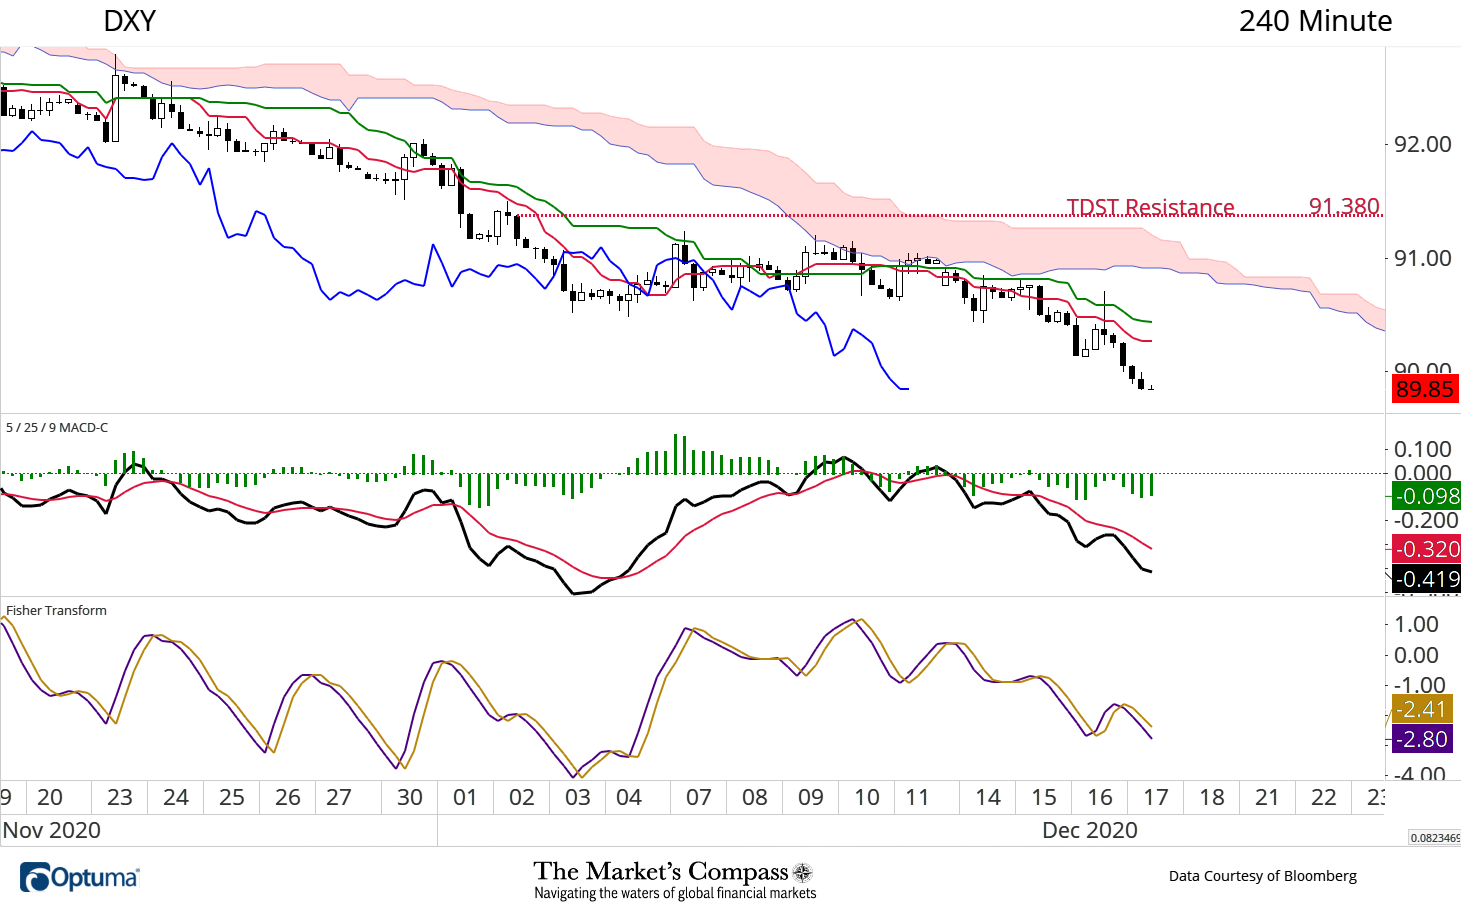
There is little question that the DXY is oversold but oversold can often beget an even more oversold condition before a price bounce occurs. We will watch the lower time frames for the first hint that a counter trend rally may be unfolding. We now mark first short term resistance at the 240-Minute Cloud and second at TDST resistance at 91.38.
Resources and Learning
To learn more about constructing the three variations of Andrews Pitchfork check out: https://www.optuma.com/pitchforks-part-2/
To try out Pitchforks and using the other technical tools I utilize in my analysis, try an exclusive free trial of Optuma Charting Software: