Toncoin (TON) Set For 40% Breakout: Buy At This Price, Says Crypto Analyst
In a technical analysis, crypto analyst Ali Martinez has identified a potential 40% breakout for Toncoin (TON), targeting an ambitious price point of $11. Martinez’s analysis, delivered through detailed chart reviews published on X, provides a robust case for TON’s impending price movement, underpinned by classical chart patterns and Fibonacci retracement levels.
Toncoin Is on The Verge Of A Major Breakout
Martinez’s first chart showcases TON/USDT plotted on a 12-hour timeframe, demonstrating a classic ascending triangle pattern. This pattern is recognized in technical analysis as a bullish signal, particularly when it forms during an uptrend as is evident with TON.
An ascending triangle is characterized by a flat upper resistance line—here, at approximately $7.54—and a rising lower trendline that sequentially creates higher lows. The convergence of these lines indicates dwindling supply and increasing demand, suggesting that a breakout is likely as the price compresses.
The target price of $11, which implies a 40% increase from the triangle’s resistance line, is derived using the measured move method. This method calculates the breakout target by adding the widest point of the triangle to the breakout point. In TON’s case, the widest part of the triangle spans approximately $3.07 (40.03%), projecting from the breakout resistance could ideally set the price near $11.
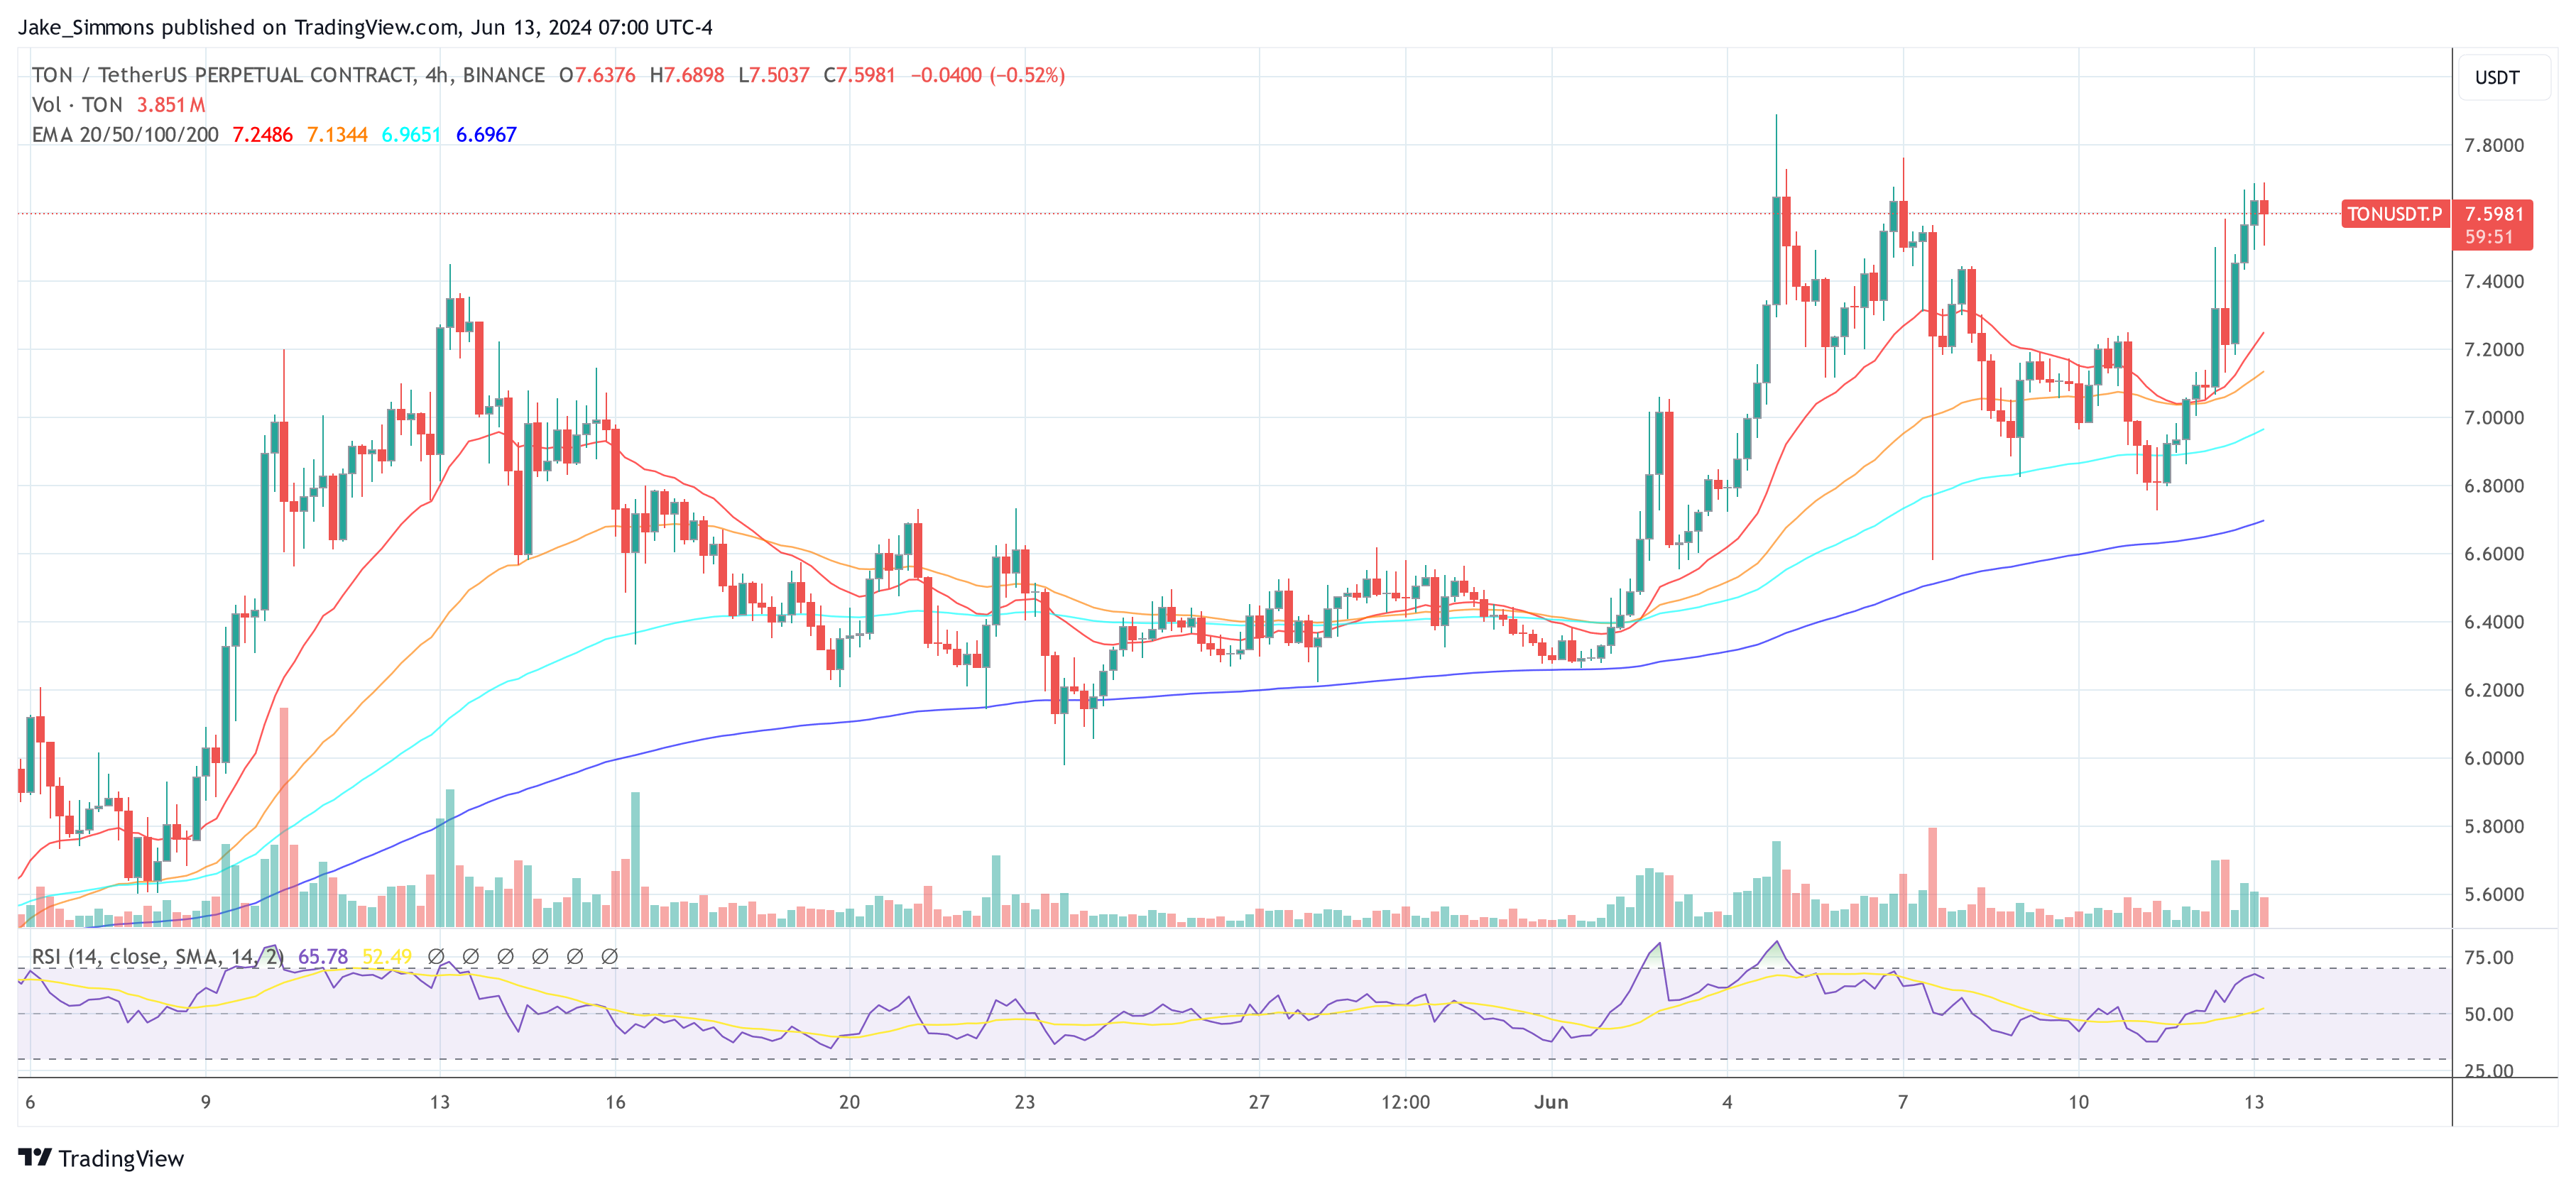
Martinez extends his analysis on a separate 4-hour chart of TON’s performance in a Tether (USDT) perpetual contract on Binance. This chart employs Fibonacci retracement levels to further refine the support and resistance thresholds. The Fibonacci levels, drawn from recent highs and lows, reveal crucial supports at $7.44 (23.6% retracement), $7.30 (38.2% retracement), $7.1912 (50% retracement) and $6.9220 (78.6% retracement).
Compounding the technical narrative, the TD Sequential indicator—an advanced tool used to predict price reversals—points to a potential short-term pullback. Martinez notes this indicator suggests that TON might dip to around $7.2, aligning with the 23.6% Fibonacci level, before making the significant bullish leap. This dip is interpreted as a strategic entry point for investors, providing a lower risk buying opportunity before the anticipated breakout.
“Toncoin is gearing up for a potential 40% breakout, aiming for $11! However, the TD Sequential indicator suggests TON might briefly dip to $7.2 to gather liquidity before the upswing,” Martinez noted via X.
For traders and investors, understanding the strategic significance of the $7.2 entry point is crucial. This level not only represents mid-point of the retracement but also serves as a psychological support zone, where the market might consolidate gains before accumulating enough momentum for the potential breakout.
At press time, Toncoin traded $7.59.


