Top 3 Cryptocurrency Weekly Price Prediction | BTC, ETH, & DOT Market Calls & Investment Tip
No one wants to sell as BTC and ETH consolidate in time vs price.
Another bullish week in the cryptocurrency market, with prices rising and returning to multi-week and multi-month highs.

Quick Snapshot
- The present market sentiment is positive. The RSI indicator also indicates an overbought state higher than 75.
- Ethereum’s price volatility over the last 30 days was 18.98%. The price of ETH is close to the 30-day high.
- POLKADOT Indicators are indicating bullish signals.
ETHEREUM
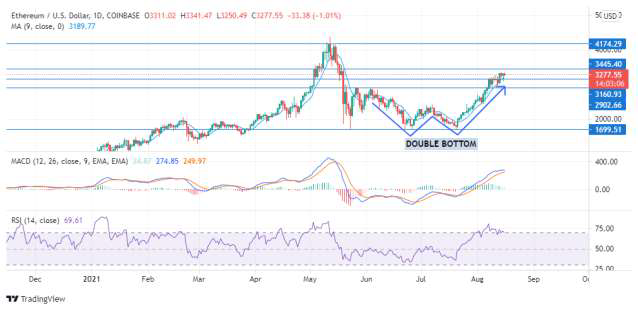
Ethereum, the second-largest cryptocurrency behind Bitcoin, has established itself in the crypto market during the last few years. Ethereum’s future seems tremendously bright. If you’re looking for a profitable investment in cryptocurrencies, ETH could be a fantastic choice.
ETH price is near about the 30 days high with 18.98% price volatility and the current sentiment of the market is bullish. The RSI indicator suggest that Ethereum price is in over brought zone with indicator above 75. ETH was in a downtrend from May to June, but after the formation of a double bottom, the trend has changed and momentum has reversed from leading price action. If the bulls can overcome a significant level of resistance, they will attempt for a rally toward $3400; Should the Ethereum price have a trend reversal, invalidating the optimistic prognosis, it can go down to around $3150.
POLKADOT
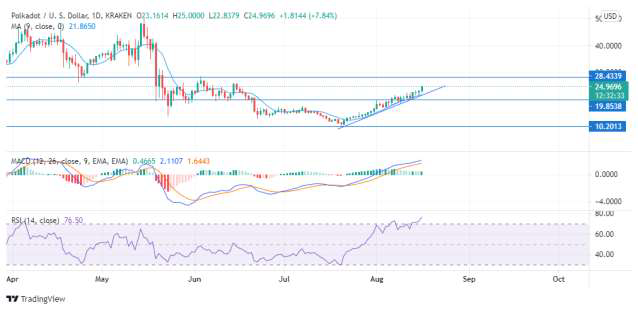
Polkadot has risen by more than 116% since its low on July 20, reaching a level not seen since June 21, at $23.51, and is close to a 30 day high. Indicators are signalling the bullish signals, and RSI indicates also suggests over brought condition. The prevailing technical trend shows that the altcoin is on the rise, with a projected target of a 14.23% increase. Following the downturn from May to July, it began to move upswing as market attitudes were bullish.
On the 12-hour chart, the polkadot price has established an ascending parallel channel as DOT has consistently recorded higher peaks and lower troughs. The last major obstacle is at around $28 The last major obstacle, before attaining the bullish level. If the market stays bullish, it may form a breakout from its resistance level.If buyers are unable to raise prices against sellers, DOT may continue to trade sideways within the parallel channel until either the bulls or the bears seize control.
BITCOIN
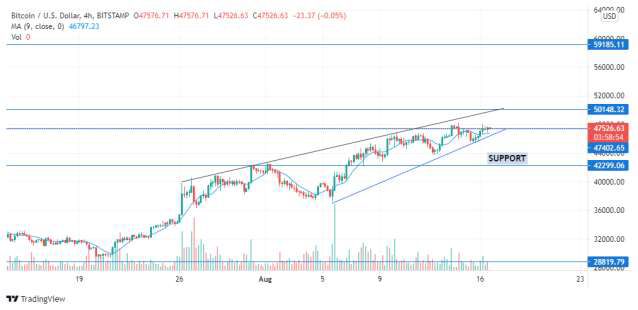
The BTC price increased 3.09% in the last 24 hours. Bitcoin price eyes $50,000 but lack of leveraged long positions may hinder rally. BTC is close to 30 days high as it is following the uptrend and indicating strong support at $42300 and resistance at around $47400. It may break out the resistance if the market sentiments remain bullish it can rally towards $50000.The prevailing technical pattern shows that Bitcoin price may be on track for a 15% increase from the neckline. The first barrier is the Momentum Reversal Indicator’s breakout line at $48,000, followed by the neckline of the inverse head-and-shoulders pattern at $49,450.
Top 3 Cryptocurrency Weekly Price Prediction | BTC, ETH, & DOT Market Calls & Investment Tip was originally published in BuyUcoin Talks on Medium, where people are continuing the conversation by highlighting and responding to this story.