What Now After Reaching Record Highs?
Summary
The Christmas rally in Bitcoin reached its terminus early Sunday morning (EST) after prices had become overbought and stretched as measured by the spread between the last sale and Cloud support but thus far a deeper price retracement has not unfolded.
If Bitcoin is able to rally and close above 27,320 on an hourly basis it has a better than even chance of revisiting the recent highs.
We now mark key short term support at 26,135.00.
Daily Time Frame
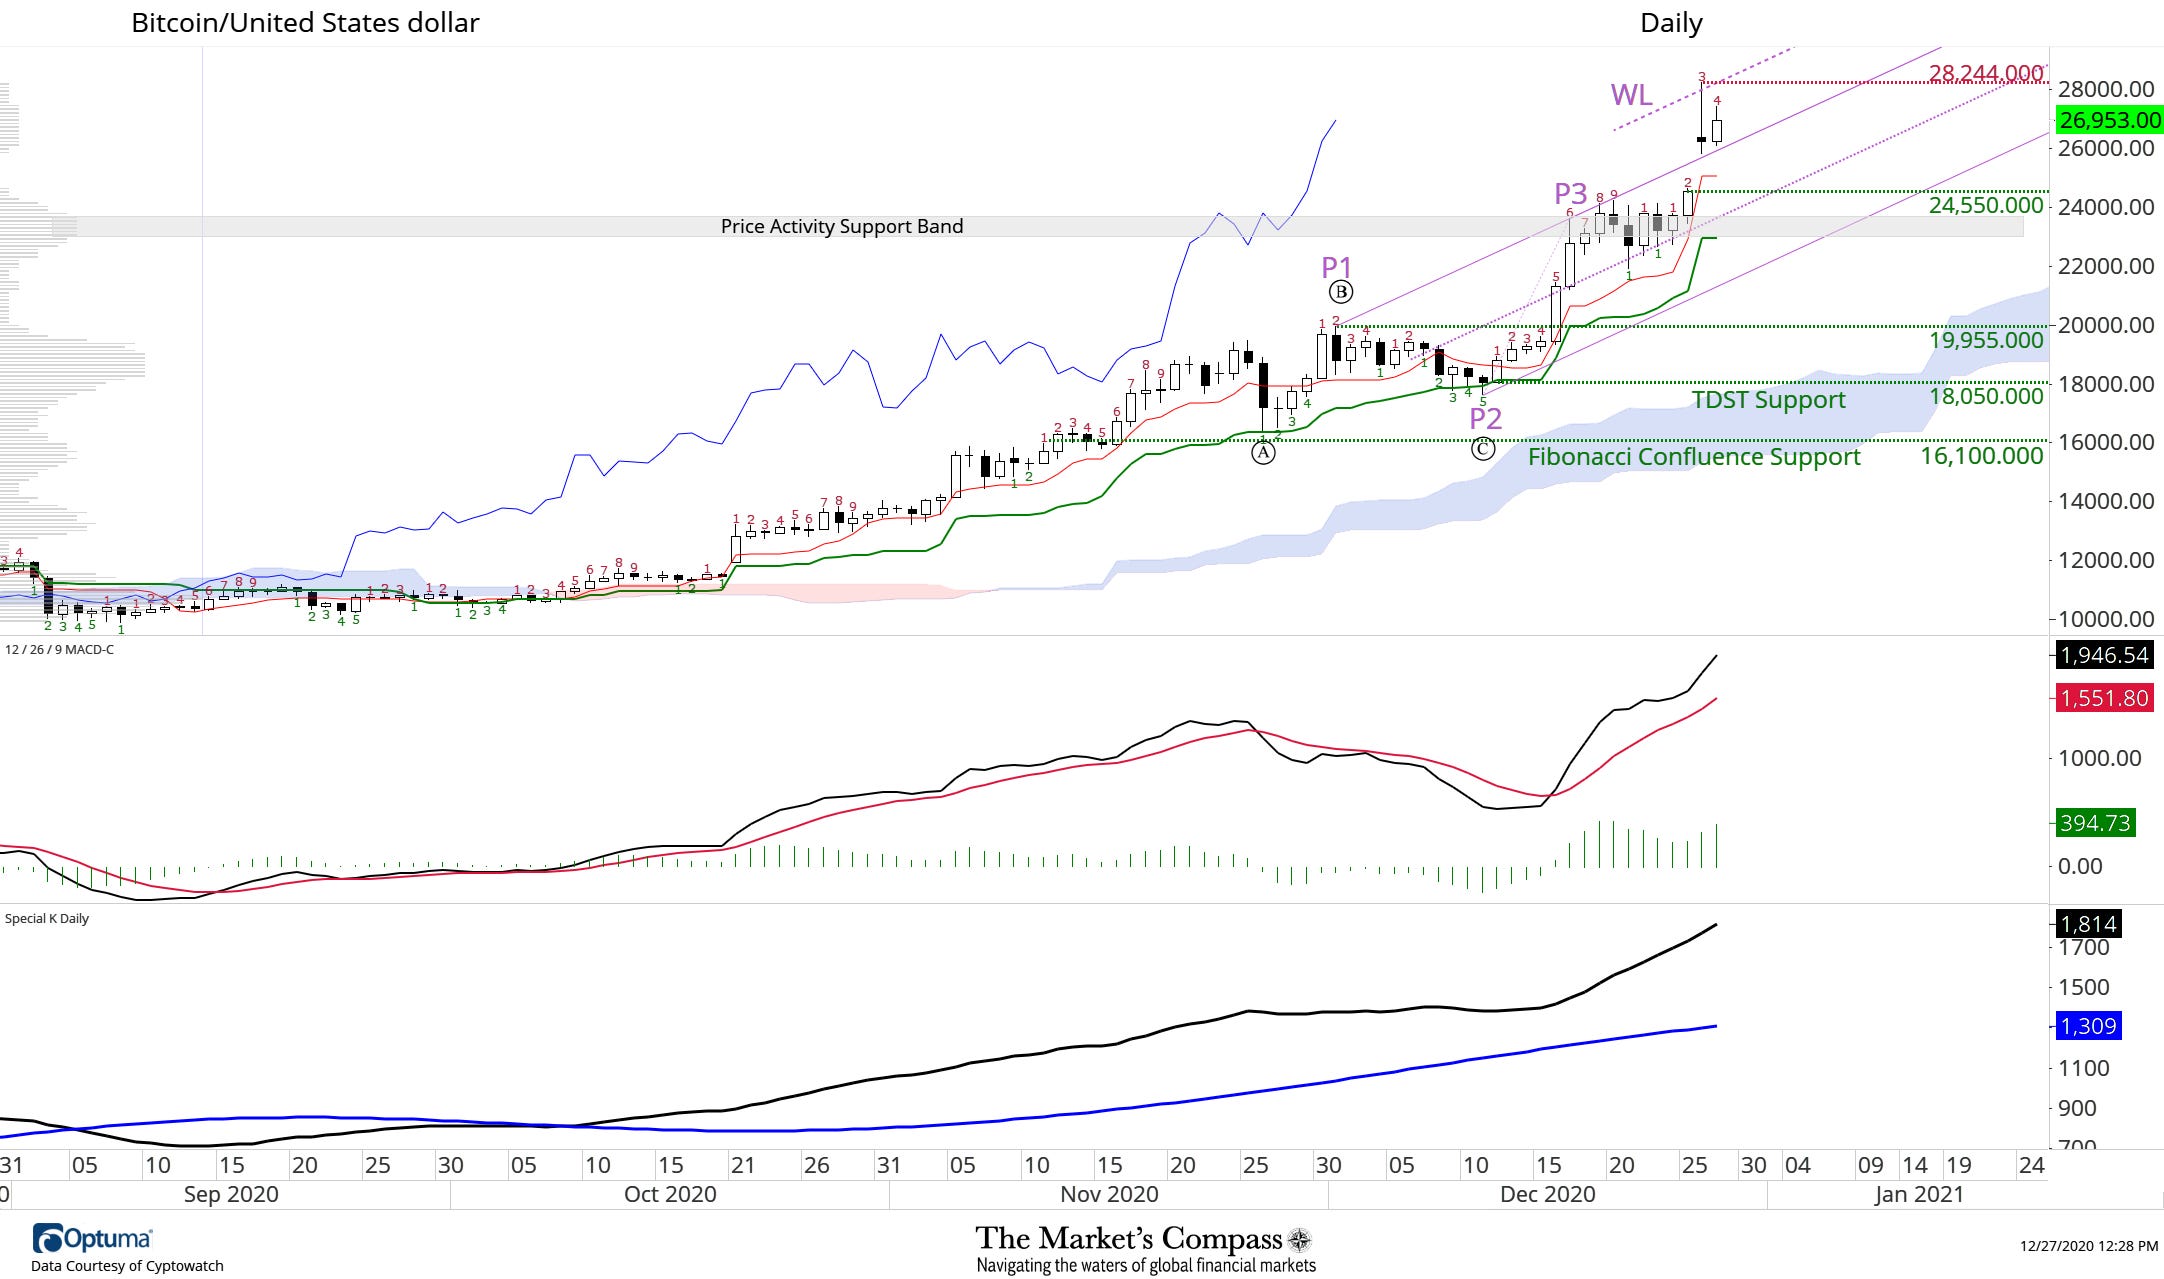
Bitcoin rallied through the Upper Parallel of the Schiff Modified Pitchfork (purple P1 through P3) and reached a record intraday high on Sunday before an overbought reversal set in when prices were repelled at the upper Warning Line (WL).
Bitcoin has started the week respecting support at the breakout above the Upper Parallel of the Pitchfork and prices have recovered a portion of the pullback from Sunday’s intra-day highs.
Neither MACD or Special K (combines short, intermediate and longer-term trends in one indicator) are signaling that the daily up trend is in jeopardy.
We now mark longer term key support at 24,550 and only a violation of that level and the Price Activity Support Band would suggest that a correction of a larger degree was unfolding.
240-Minute Time Frame
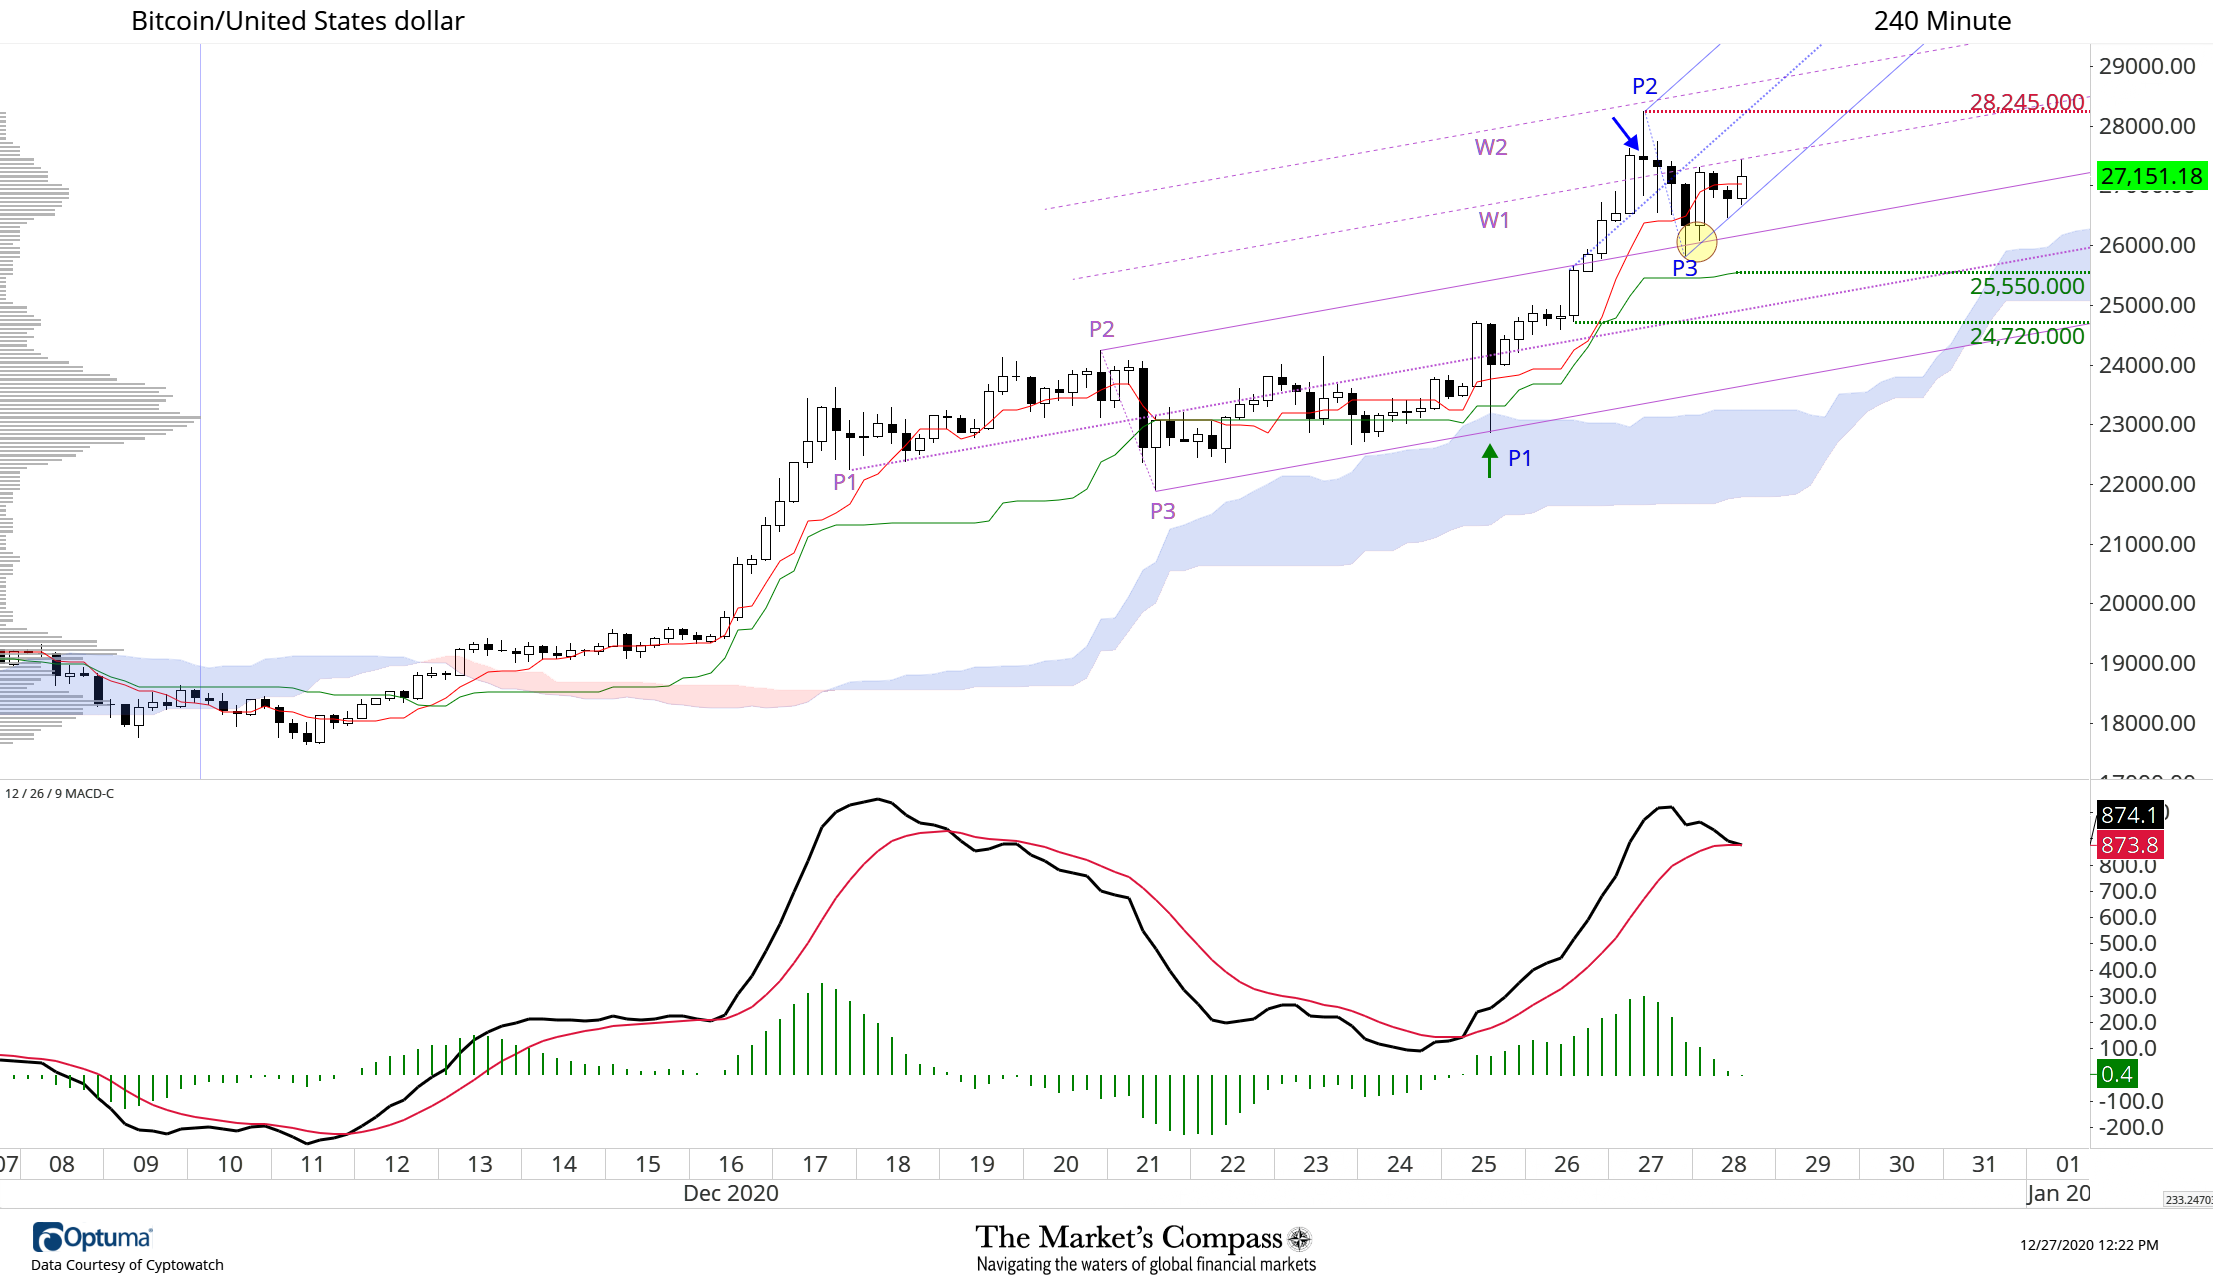
There was a successful test of support at the Lower Parallel of the Standard Pitchfork and the Cloud (green arrow) on Christmas morning (EST) and a reversal followed that led to Saturday’s triumphant assault on the Upper Parallel of the Pitchfork.
Sunday’s extension of the rally through the first Warning Line (W1) fell short of the second Warning Line (W2) in a long-legged doji (blue arrow) suggesting a dose of indecision that instilled the question that maybe the rally had run too far too quickly.
During the price retracement that followed, prices held above the Upper Parallel of the Pitchfork (yellow circle) and since then Warning Line #1 has capped attempts to challenge the record highs. This tells us that the vector or angle discovered by the Standard Pitchfork remains valid.
We have drawn a new short term Schiff Modified Pitchfork (blue P1 through P3) and the Lower Parallel has cradled the rally since the swing low at blue P3. First Support on the 240-minute time frame is at the Kijun Span (green line) at 25,550 and second is marked at 24,720 where the rally began to accelerate.
60-Minute Time Frame
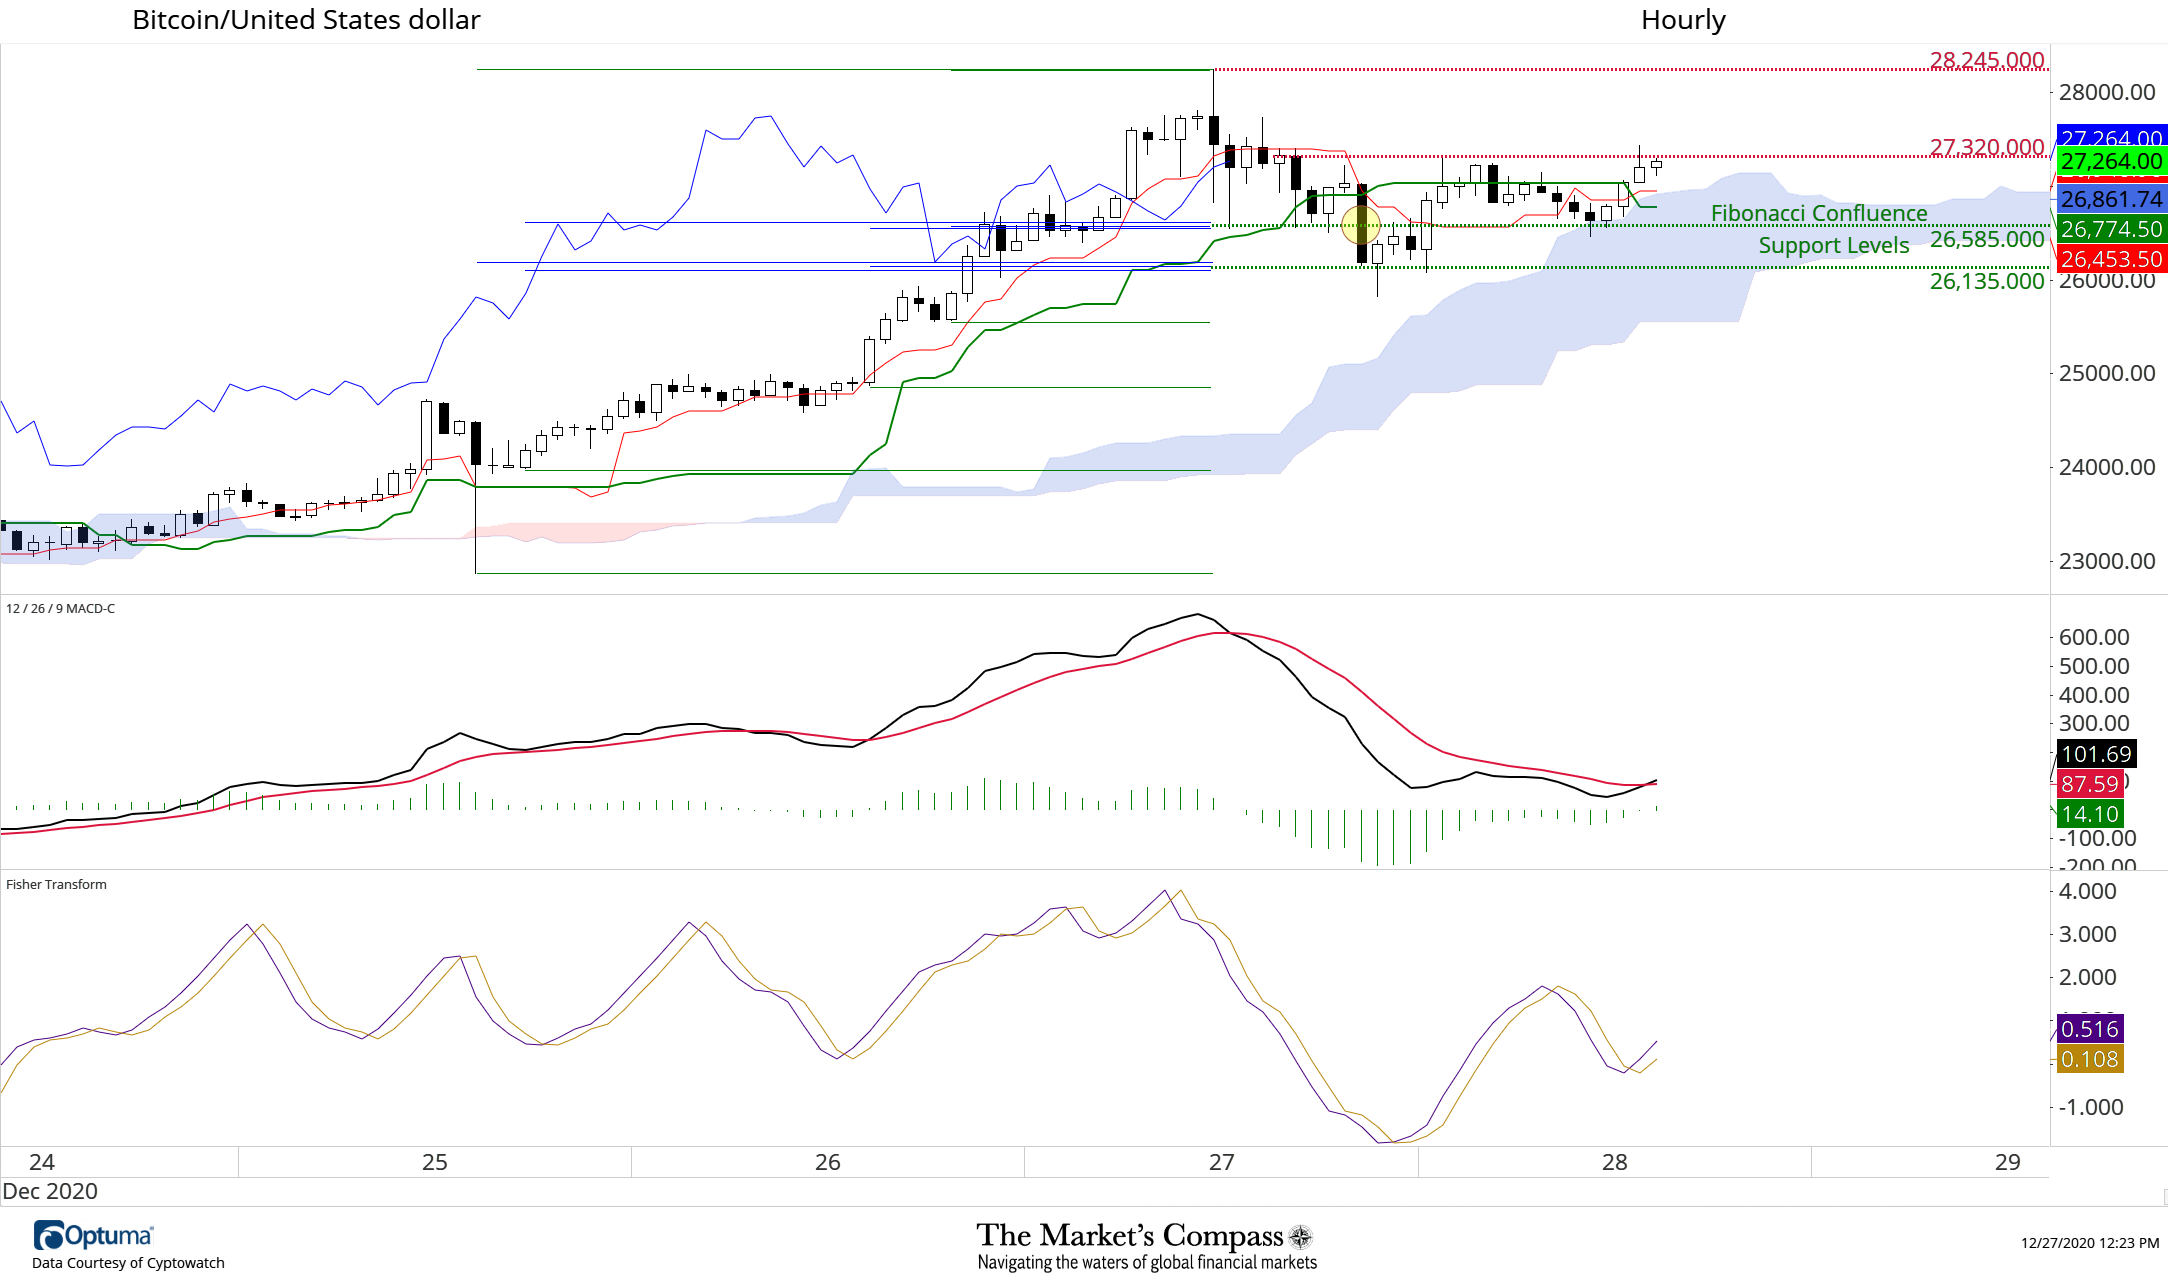
Early Sunday morning (EST), prices had become overbought and stretched far above Cloud support.
The first short term hourly Fibonacci Confluence Support Zone (26,585) held on a closing basis until yesterday afternoon (yellow circle). The Lower Confluence Zone (26,135) was called into play and on an hourly closing basis it acted as a support shelf where buyers were comfortable stepping in. Despite this, a complete reversal did not unfold and prices continued to churn until Cloud support developed into a higher low.
MACD has managed to hold the ground in positive territory and is currently crossing above its signal line. That being said, thus far the momentum oscillator is only reflecting a slowing of down side momentum not a reversal and acceleration to higher prices.
Only an hourly close above 27,320 would give us a level of confidence that the short term correction has run its course.
Resources and Learning
To learn more about the tools I use to develop my technical thesis’s in crypto currencies and other financial markets follow the link below for a brief tutorial titled “Tools of Technical Analysis” and for the three part Pitchfork series co-authored with Kyle Crystal of Lakeshore Technical Analysis at
Follow this link below for an exclusive 30-day free trial of Optuma’s Charting Sortware: